A couple of charts from Ron Griess over at The Chart Store that might be worth watching, especially in light of today’s FOMC announcement at 2:15:
>
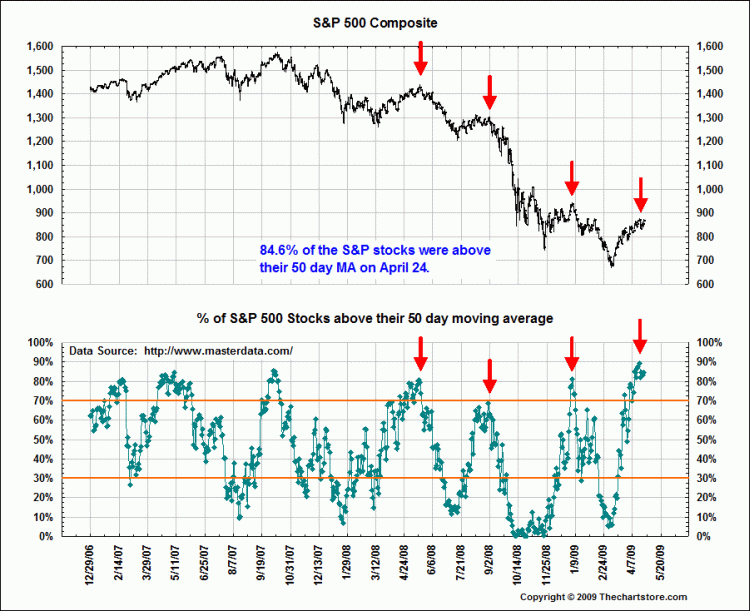
The first is S&P500 Stocks over 50 day Moving Average
>
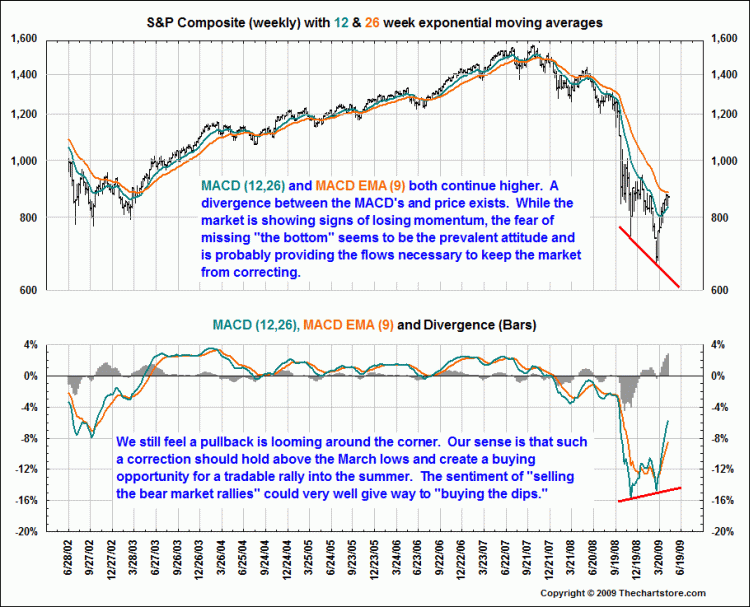
The next chart is the S&P500 Index Divergence vs S&P500 MACD

Graphics courtesy of The Chart Store
>
Both of these suggest a pullback is possible; Given how stocks have traded on prior FOMC days, and the Dow up 175, this suggests caution may be warranted here . . .


What's been said:
Discussions found on the web: