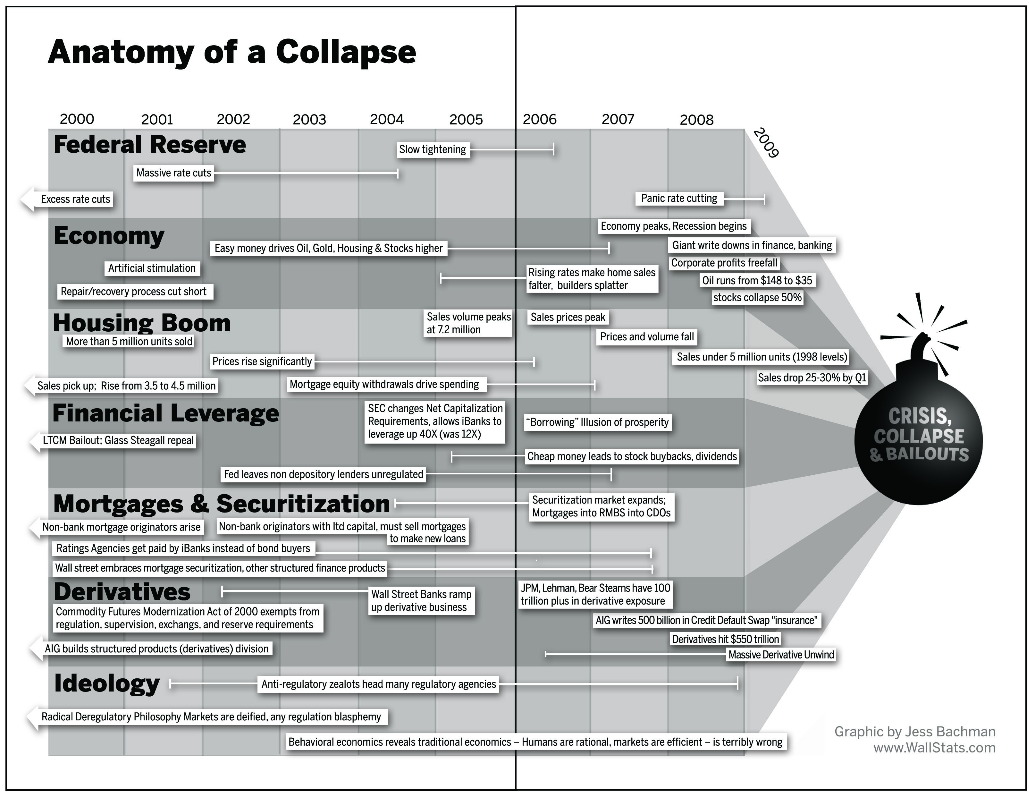
As I was working on Bailout Nation, I struggled to find a way to communicate the myriad forces that combined to cause the collapse. The book details the many elements involved, but I wanted a visual way to depict what I took 20 chapters to explain.
I had long been a fan of Wall Stats — the great site that Jess Bachman runs. Over the course of a few days, I described the various factors and how they interact.
Jess took what I described, and turned it into a terrific graphic that goes a long way to explain what happened (credit the bomb to Mrs Big Picture).
It became the centerfold of the book, running just before Part IV (Bailout Nation).
>

>
I don’t think any other graphic has so cleanly depicted the factors that led to the crisis developed . . .


What's been said:
Discussions found on the web: