The latest data from Case Shiller, covering the October 2009 period, shows an ongoing improvement in price data.
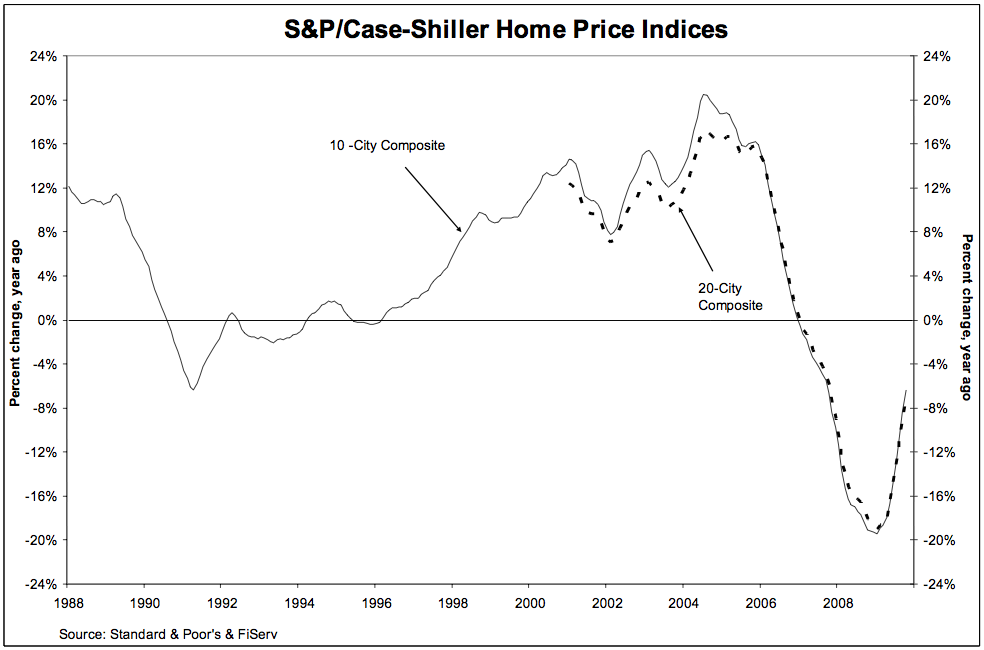
This was the 9th consecutive month of gains. As the chart below shows, year-over-year data for the 10-City and 20-City Composite Home Price Indices, fell 6.4% and 7.3%.
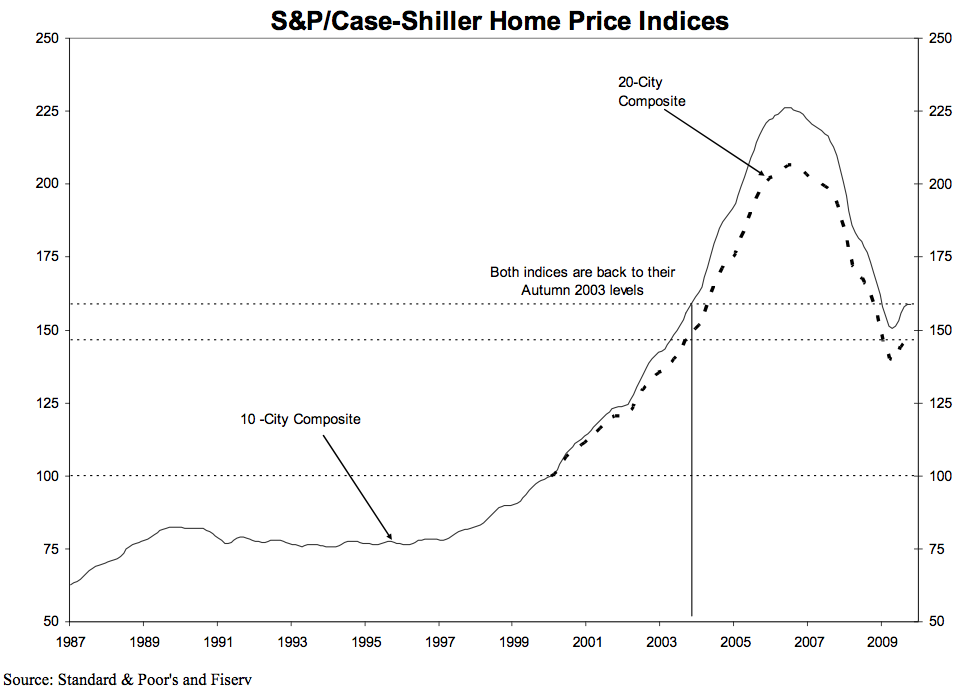
Peak-to-date figures for the indices through October 2009 are -29.8% and -29.0%; Peak to trough (April 2009) composites are down 33.5% and 32.6%, respectively.
S&P noted “The turn-around in home prices seen in the Spring and Summer has faded, with only seven of the 20 cities seeing month-to-month gains, although all 20 continue to show improvements on a year-over-year basis.”
>
Case Shiller Index October 2009
click for bigger graphic

All data courtesy of S&P/Case Shiller
>
More charts after the jump . . .
National Prices = Autumn 2003
>
Source:
Home Prices Still Improving but at a Moderating Pace
S&P/Case-Shiller 29-Dec-2009 09:00
http://www.standardandpoors.com/indices/sp-case-shiller-home-price-indices/en/us/?indexId=spusa-cashpidff–p-us—-


What's been said:
Discussions found on the web: