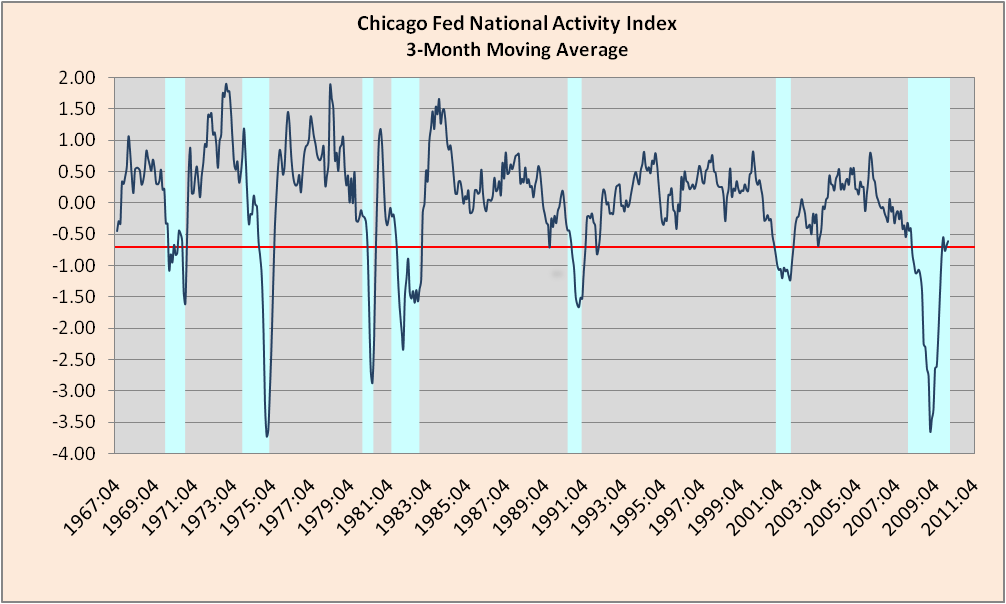
While everyone awaits GDP data this morning, why don’t we look at the best economic gauge you have never heard of:
It doesn’t appear on any economic calendars that I’m aware of. It flies under just about everyone’s radar. Technically, it’s not a data point itself but a weighted amalgam of 85 other distinct economic data points, an all-in-one look at the United States economy.
And it does an excellent job of tracking the economy’s health.
It’s the Chicago Fed’s National Activity Index (CFNAI), and it just printed for December.
Say the folks in Chicago:
The CFNAI is a weighted average of 85 existing monthly indicators(pdf) of national economic activity. It is constructed to have an average value of zero and a standard deviation of one. Since economic activity tends toward trend growth rate over time, a positive index reading corresponds to growth above trend and a negative index reading corresponds to growth below trend.
The 85 economic indicators that are included in the CFNAI are drawn from four broad categories of data: production and income; employment, unemployment, and hours; personal consumption and housing; and sales, orders, and inventories. Each of these data series measures some aspect of overall macroeconomic activity. The derived index provides a single, summary measure of a factor common to these national economic data.
Additionally, they advise us to focus on the three month moving average:
Month-to-month movements can be volatile, so the index’s three-month moving average, the CFNAI-MA3, provides a more consistent picture of national economic growth.
When the CFNAI-MA3 value moves below –0.70 following a period of economic expansion, there is an increasing likelihood that a recession has begun.
When the CFNAI-MA3 value moves above +0.70 more than two years into an economic expansion, there is an increasing likelihood that a period of sustained increasing inflation has begun.
That said, here’s the chart:
Source: Chicago Fed
>
The MA3 has stalled since hitting -0.54 in September, recording -0.76, -0.68, and now -0.61 since then. We’ve gotten the bungee bounce off the economic and market lows of almost one year ago. The question now — as I’ve been opining for quite some time — is to sustainability. We’re clearly faltering, with nary a green shoot in sight (witness the just-released Durable Goods orders and weekly Unemployment Claims, which were both weaker than expected). Lots of interesting numbers coming out over the next week, culminating with Friday’s jobs report. The stock market is, perhaps, starting to recognize the loss of momentum.
Interesting times . . .


What's been said:
Discussions found on the web: