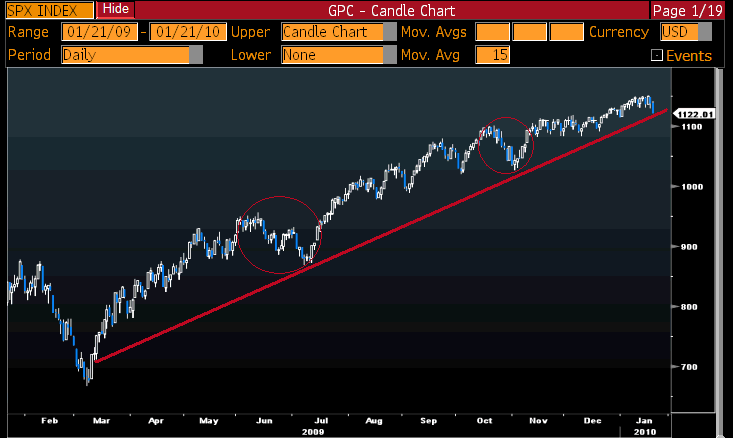
Since the lows in March 2009, the market has yet to correct 10%. In June, there was a 9% pullback, followed by a 6.5% pullback in September.
So far, we have a volatile few days, but any 5 day chart is mostly noise:
>
Day to Day Action: Its Mostly Noise
>
As the 12 month chart shows, the long term trend remains in effect. Watch 1114 on the SPX. Major support at 1078 — that is the level most traders will be watching.
>
Trend Remains in Place
>
One last thing that few people admit: These trend lines are very subjectively drawn, and you can easily alter the outcome by selectively placing lines at bottoms or tops.


What's been said:
Discussions found on the web: