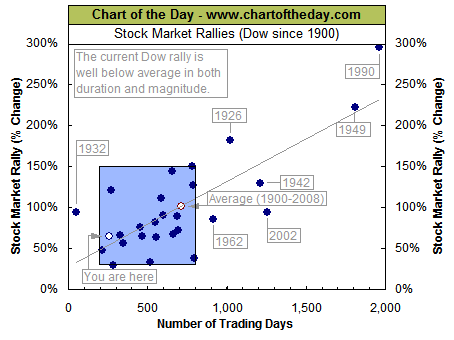
Chart of the Day takes a broad — perhaps over broad– look at trading rallies. They found that major rallies (73%) result in a gains ranging from 30% to 150%. Typically, they last between 200 and 800 trading days.
Based on this data, you can conclude that the present rally is still young, and potentially has a long way to run.
That might be a premature assumption.
As we’ve discussed before, there are huge differences between cyclical and secular markets. I have been describing the current short sharp run as a cyclical bull within a longer, secular bear.
If we were to look at the duration and intensity of rallies between 1929-38 or 1966-82, or 2000-09, I suspect we would find they are both shorter, sharper. By definition, cyclical bulls are of smaller duration than secular bull markets.
Here’s your daily chart porn:
>
Age and Duration of Rallies

Source: Chart of the Day


What's been said:
Discussions found on the web: