Despite my association with the Bear camp, and my belief that we are most likely in a long term secular bear market, I actually am an optimistic guy.
The future is never as dire looking as the survivalists make it out to be. Even though I know the cyclical bull rally within the longer bear will eventually end with a significant correction of ~25%, I have been playing this on the long side. That’s optimism!
I lived through the 1970s — an era of sky high interest rates, ugly cars, polyester and disco — so I now how bad life can get in the USA.
My motto: Hope for the best, but be prepared for the worst.
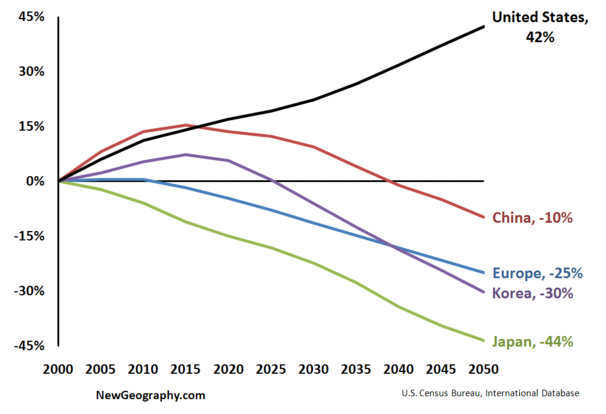
With that thought in mind, let’s have a look at a long term chart that is actually encouraging. It comes from the book “The Next Hundred Million: America in 2050.” Many people are surprised to learn that America “boasts the highest fertility rate: 50 percent higher than Russia, Germany or Japan, and well above that of China, Italy, Singapore, Korea and virtually all of eastern Europe.”
In terms of economic development, this demographic factor provides a long term advantage — think of the financial bulge of the Baby Boomers (while ignoring everything else they screwed up).
That leaves us with this chart, which has potenetially long term, positive connotations:
>
Labor Force Growth (growth in age 15-64)

Chart courtesy of Joel Kotkin
>
Hat tip Kevin!


What's been said:
Discussions found on the web: