Matt Trivisonno no stranger to these pages. He has set up a new site to do “Real-Time Tracking of the US Economy Using Withholding Tax Revenue:” : The Daily Jobs Update.
Here’s Matt:
“I’m thinking that if payrolls stay flat, the annual growth rate can move up to zero. But to move above zero will require that some new net jobs get created. I hope we get that, but in 2002 we had a massive real-estate building spree going on and creating jobs for every body from copper miners to i-bankers. We don’t have anything like that today.
So, I do worry that we won’t be able to run up to +8% as fast as we did last time.”
And of course, Matt has some new charts for us:
This is the daily plot of the annual growth rate of the raw data. Matt observes we are making the same pattern that we did at the bottom of the last recession in 2002.
>
Daily Federal Withholding Year over Year Percentage Change
>
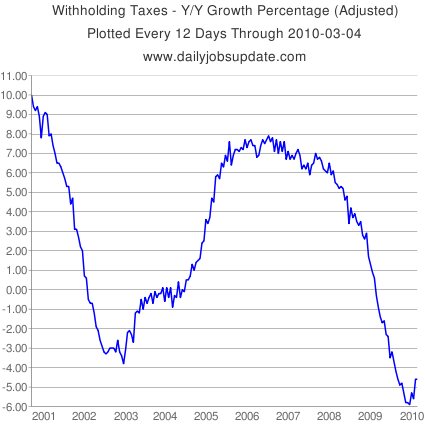
The next chart is also an annual, but plotted every 12 days to smooth the line. Its also adjusted to reflect when the April 2009 withholding tax credit went into effect. then, so I created a second data series to try and estimate what withholdings would have been without the credit. (Methodology here) With the adjustments, the curve has turned up decisively.
>
>
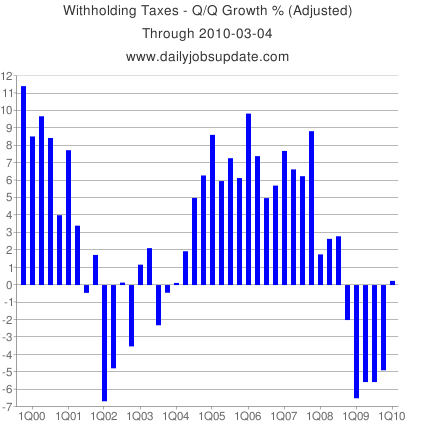
Here are the Quarterly-Adjusted version (except for the last four quarters). Those four bars use the adjusted data.
>
These charts are updated every day at: The Daily Jobs Update. If you want the most up-to-date, real time tax data, you can also become a paying subscriber to his site there.


What's been said:
Discussions found on the web: