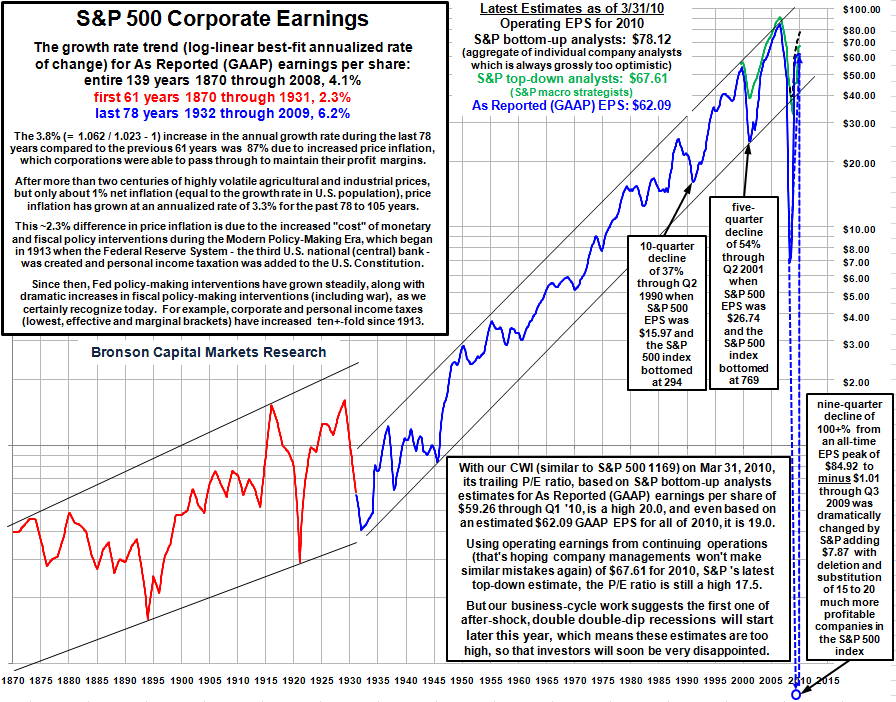
We’ve run many charts over the years from Bob Bronson. Back in late 2008, Bob was forecasting a S&P500 Q4 earnings collapse.
Let’s balance this morning’s guarded bullish comments with commentary a touch less optimistic.
As the chart below shows, he might have been too optimistic!
Here is what Doug of D-Short had to say about this particular graph:
“The bullishly-biased financial media continue to tout supposedly “strong corporate earnings” to justify investors buying stocks at ever more expensive prices. Investors are not reminded, however, that the key factor driving both the magnitude and timing of this rebound is that it is coming off last year’s extraordinarily low EPS base — in fact, the lowest base in over 140 years of U.S. corporate history!
The two recent quarters of the rebound in EPS came only after nine quarters of decline that amounted to the biggest drop in EPS since The Great Depression, as measured by the companies of the Standard & Poor’s 500 index and its previous and subsequent indexes that we use in our database, described here: Revealing BAAC Supercycles.
Moreover, the plunge in EPS would have been the worst ever recorded (see the steep, nearly vertical drop in blue dotted line in the chart below) if Standard & Poor’s had not removed 15 to 20 companies reporting huge losses (primarily financial-sector companies) from the index and replaced them with much more profitable companies. “
In other words, though earnings are improving, they are coming off such low levels as to require the rampaging bulls take it down a notch or three.


What's been said:
Discussions found on the web: