Last month, Matt Trivisonno shared his Daily Jobs Update research regarding payroll withholding taxes. (Payroll Withholding Taxes Surge in March).
Zero Hedge challenged the data (Now, About This Alleged Increase In Tax Withholdings By The Government). Here is Trivisonno’s response…
~~~
In the attached chart, I used ZH’s own numbers. I combined the first 12 weeks of the year into three bars of four weeks each and calculated the year-over-year growth percentage. As you can see, the improvement has been dramatic.
>
>
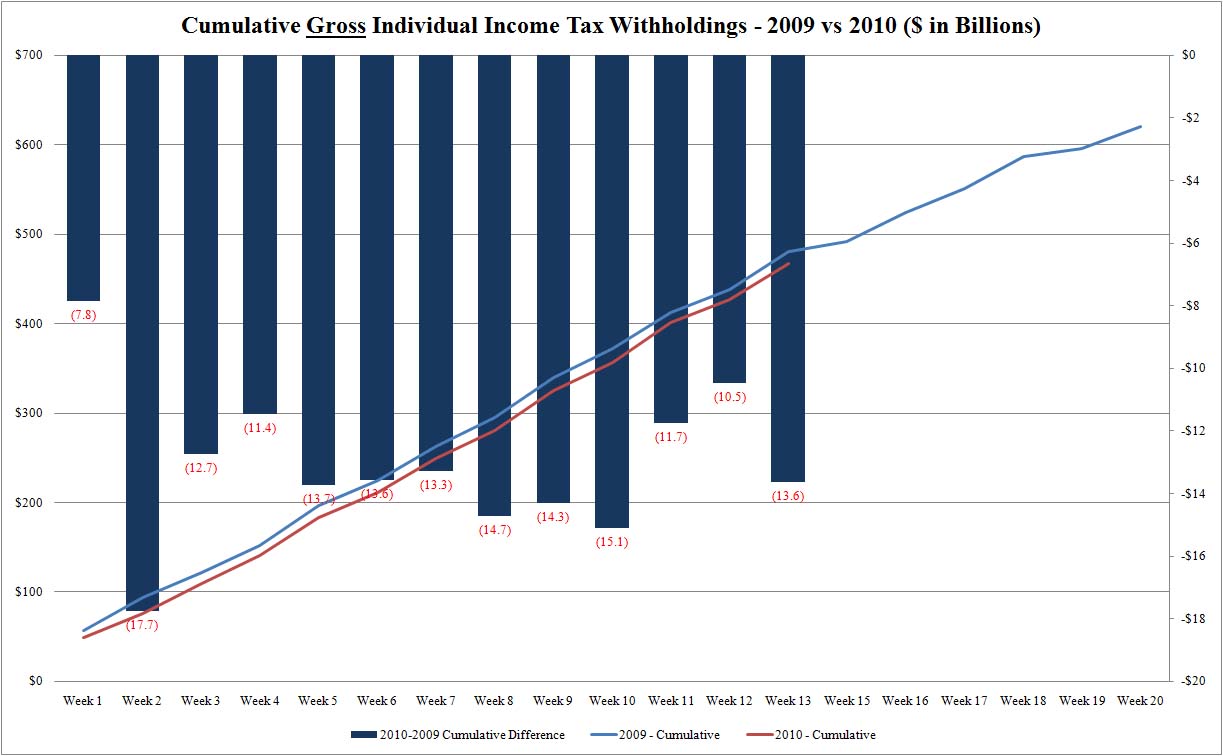
ZH’s second chart (below) isn’t really material. Since the first two months of the year were negative, of course the total for the year is still negative. But that isn’t the point, right? We are looking for a trend, after all. And since ZH did not take into consideration the tax-credit that began in April 2009, their unadjusted numbers understate withholdings for the first three months of this year by a substantial amount.
>

Source: Zero Hedge
$450,723 million – Withholdings for Q109
$444,852 million – Withholdings for Q110
On the unadjusted data, there is about a $6 billion shortfall this year. However, using the guesstimates of the Congressional Budget Office, I estimate:
$463,027 million – Withholding for Q110 (adjusted)
So, it is very likely that the economy has added jobs for all of Q1. This page explains my adjustment methodology and has links to the CBO reports:
ZH’s concept of “net withholdings” doesn’t make sense. The purpose of looking at the withholding data is to try and get an idea of how many paychecks are being cut, not to make an accounting of the federal government’s cash flow. If you back-out tax refunds, then you have to consider what changes to the tax code may have had an effect. And the
“American Recovery and Reinvestment Act of 2009” had many provisions.
The bottom line is that there were almost certainly more paychecks for the IRS to tax in 1Q10 than there were in 1Q09, and that means that the economy is expanding.
ZH also included 6 work days in its Week #1 for 2009, and only 5 for Week #1 2010. Due to the New Year’s Day holiday, some of the carry-over is probably justified, but they cheated a little bit there.
Note: Since the tax credit began in April 2009 and is still in effect, starting this month we can make apples-to-apples comparisons with the raw data.
In the attached spreadsheet (Zero Hedge Rebuttal) I have broken the withholding data down into weeks, and then made three subtotals of four weeks each. Those subtotals appear on the chart, which is on the second page of the spreadsheet. Weeks 13 and 14 are not on the chart since they are part of the second quarter. Week 13 was weak, but Week 14 made up for it.
>
-Matt
Daily Jobs Update
http://www.dailyjobsupdate.com/
Trivisonno.com
http://www.trivisonno.com/


What's been said:
Discussions found on the web: