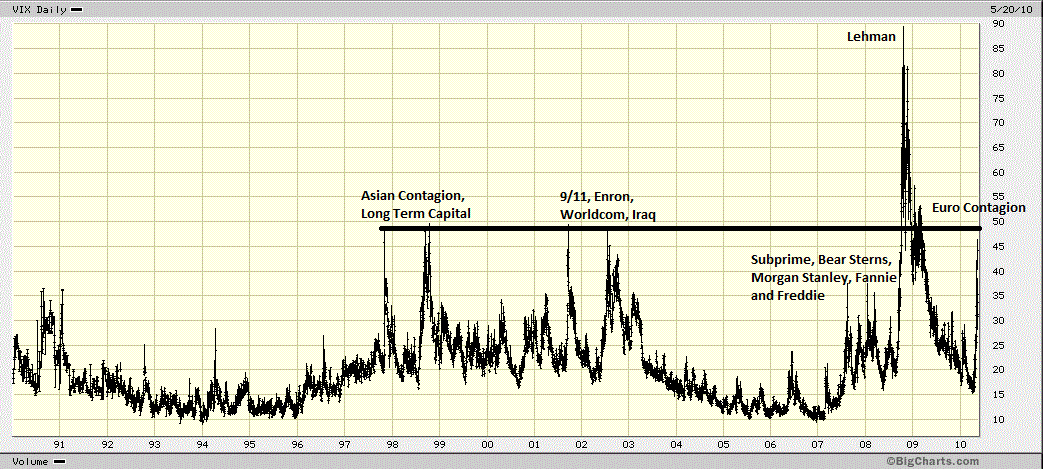
Given today’s volatility — we gapped down 2.5%, now are climbing to minus 1.5% — today’s lunchtime chart is this fascinating look at the long term history of the VIX, below
As you can see, the Volatility Index is now above the levels it hit during the Bear Stearns collapse, Fannie & Freddie’s Fall, and Morgan Stanley’s wobble. It is near levels reached during the Asian Contagion, LTCM, and 9/11. The VIX remains far below the Lehman/AIG collapse.
>
VIX 1990-2010
>
Hat tip Mike S.


What's been said:
Discussions found on the web: