NASDAQ Cumulative Volume

Chart courtesy Fusion Analytics
>
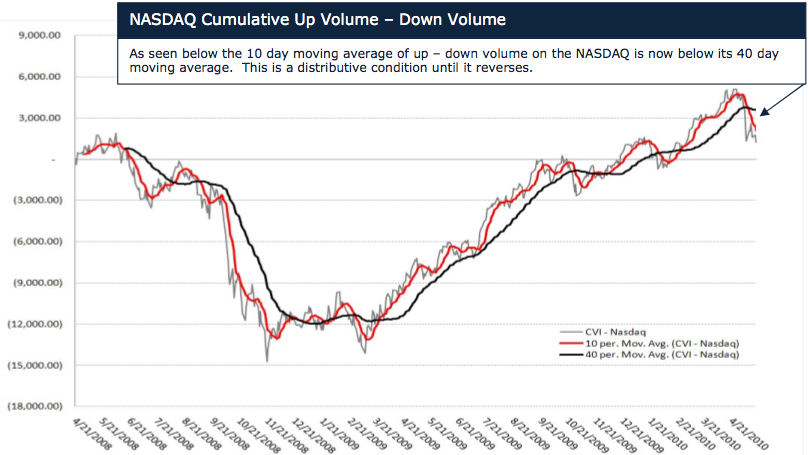
The chart above represents the cumulative total of daily up volume plus down volume on the NASDAQ. The red and black lines are 10 and 40 day moving averages of the raw data. When the 10 day moving average is below the 40 day it typically suggests distribution and negative price action, thus we remain cautious.
Only when this condition reverses should we expect a more sustained bounce.
>
Internals Distributive, Volatility High
>
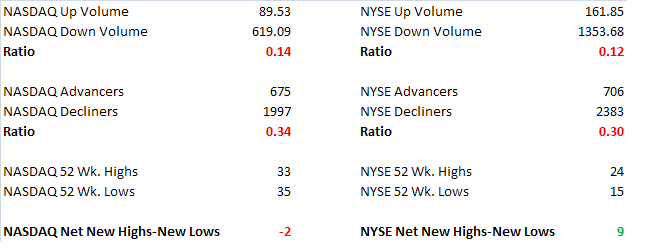
As seen in the table above sellers still remain the dominant player on the tape as down volume and decliners once again dominated today’s trading.
>
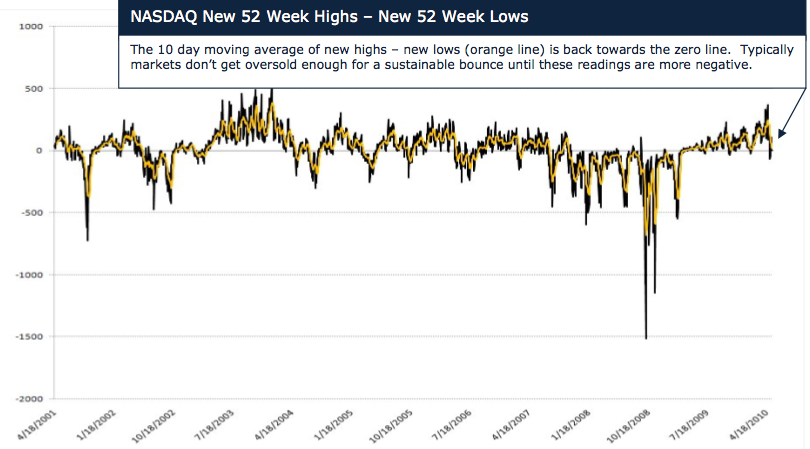
Nasdaq 52 week Hi-Lows

Chart courtesy Fusion Analytics
So far internals remain distributive and deteriorating. On a positive note however they are moving towards conditions that would suggest an oversold relief rally can occur soon.
~~~
For more information on Fusion Analytics research and trading, please contact Peter Greene:
-Telephone 212.661.2022
-Email pgreene AT fusioninvest DOTcom


What's been said:
Discussions found on the web: