(Invictus here, friends. Please note that technical problems booted me out of this post before I was done with it, and it posted before I could get back in. Therefore I’m doing I’ve done some after-the-fact editing, which I would normally not do.)
As readers may know, I have used some pixels here and elsewhere exploring what I think is a very under-reported story — how demographics is playing into our current economic situation (making it worse, actually). The interesting thing about demographics is that they are what they are, which is to say there’s generally no legislating them (unless you’re China, of course). But let’s stipulate that we’re not heading down that road and, even if we did, it’s already too late to alter our current situation. (Some of my previous posts surrounding demographics can be seen here, here, here, here and here, to cite but a handful.)
This post will expound a bit on the Boomer theme with some chart porn that I think helps to drive home my point, and that I’ve not seen explored elsewhere.
We all know that the recovery we’ve experienced over the past four quarters has been — let’s be honest — mostly statistical in nature. Most Americans still feel or believe the country is in recession. What we’ve seen is, essentially, a huge inventory restocking, which is likely winding down. And the handoff to the private sector is wobbly and hardly assured.
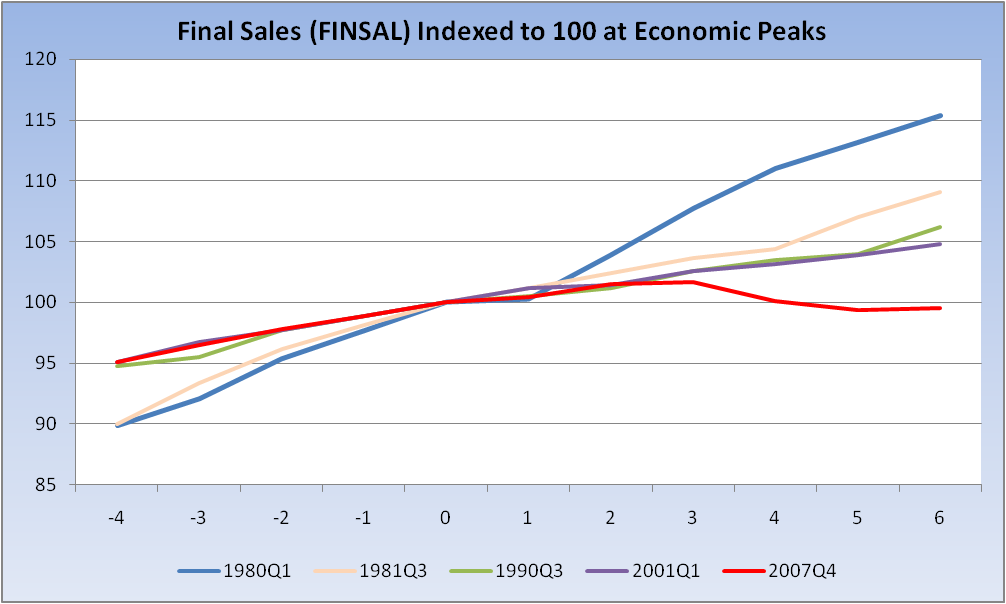
Final Sales (BEA.gov, Table 1.2.1, Line 2) has been running at a very tepid pace. In fact, it’s the worst pace on record. Let’s look at how this has played out since the Boomers made their way into the real world:
(Source: St. Louis Fed)
For every one of the past five recessions, Final Sales is relatively weaker six quarters from the economic peak than it was in the prior recession, with our most recent experience being the weakest yet.
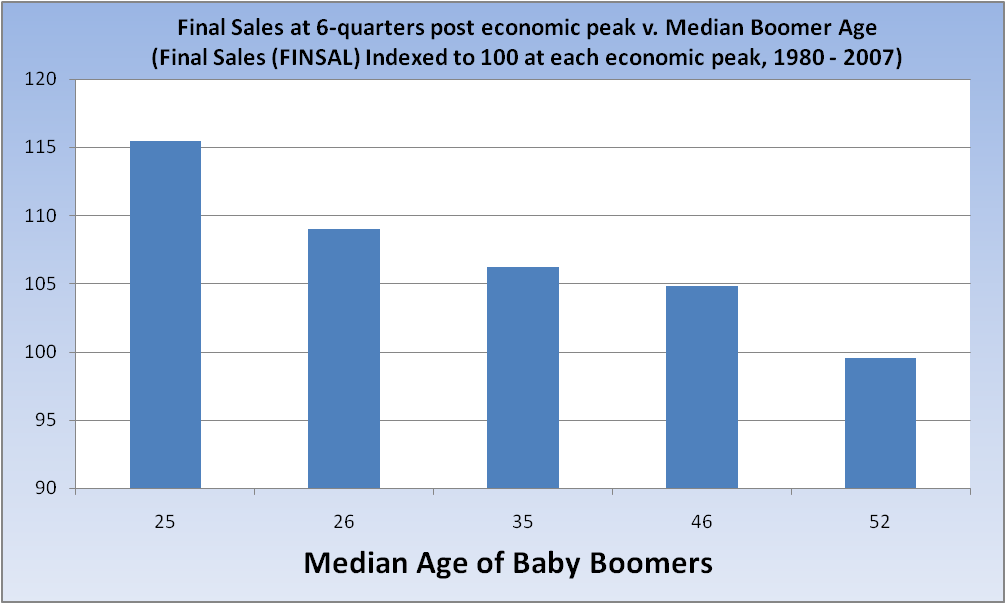
Let’s take the data above and produce another chart that looks at the same data a bit differently and incorporates the age of Boomers along the x-axis:
(Source St. Louis Fed for y-axis, assumption of 1955 as mid-point of baby-boomer era from 1946 – 1964 for x-axis)
(I get the whole “correlation does not imply causation” schtick, but there is very ample evidence of the impact of our aging population. The information provided here does not even scratch the surface.)
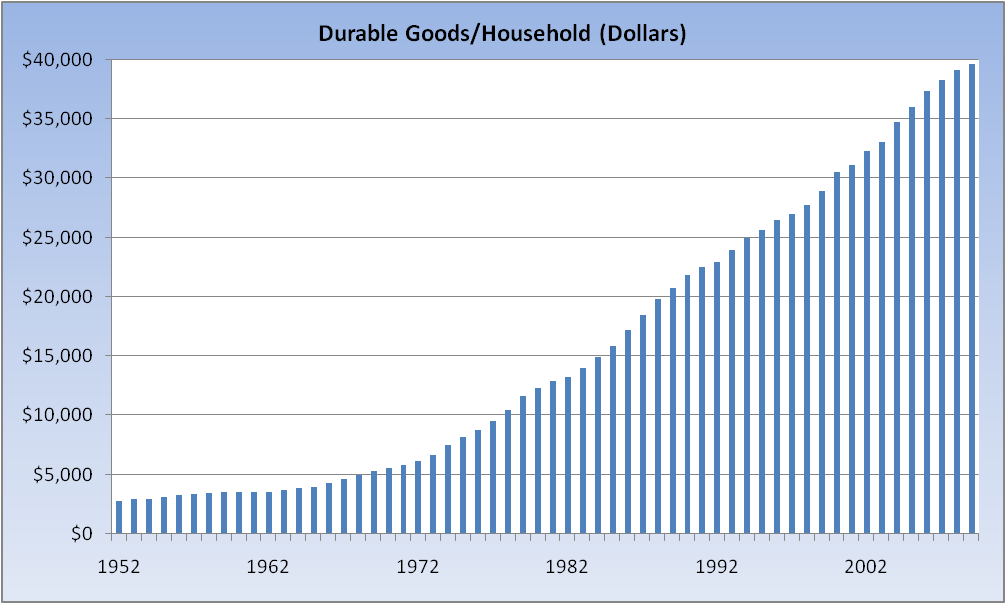
One trend that’s likely behind the pattern apparent in the Final Sales series is our accumulation of all manner of “stuff” — Durable Goods to be precise:
(Source: Fed’s Flow of Funds, Census.gov. Durable Goods at replacement (current) cost.)
Along the lines of accumulated stuff, here are some tidbits from the Self Storage Association (much more at the link):
The self storage industry has been one of the fastest-growing sectors of the United States commercial real estate industry over the period of the last 35 years [Ed. Note: Coincides with the rise of the Boomer.] It took the self storage industry more than 25 years to build its first billion square feet of space; it added the second billion square feet in just 8 years (1998-2005) During the peak development years (2004-2005) 8,694 new self storage facilities (approximately 480 million square feet of space were added)
There may be good news on the horizon, though, as this nugget from the SSA is all too consistent with a deleveraging consumer:
Fewer than 250 new self storage facilities came on line in the U.S. during 2009; the trend in new construction is down significantly the last four years
And that’s today’s Boomer update. Thoughts?


What's been said:
Discussions found on the web: