After the weekend housing discussions, I received a few emails, asking: “Why do you think the worst of housing is behind us? Why can’t we fall another 33%?”
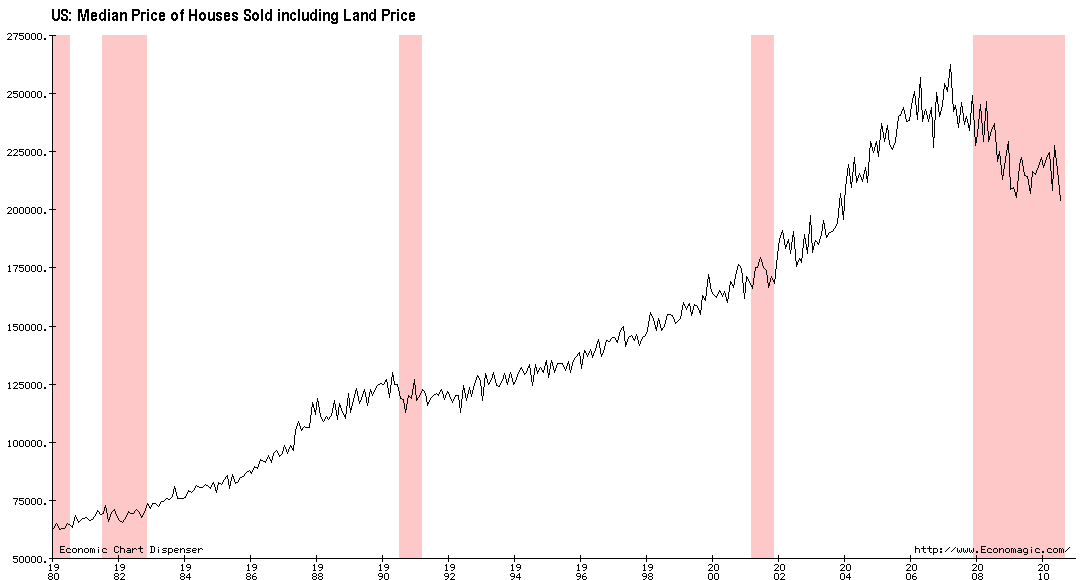
The short answer is, Prices certainly can fall much further; it is possible. However, I am making (what I believe is) a higher probability argument due to fair value. My basis for saying the worst is likely over are prices: We are off 33% from the peak, and as of the end of Q1, were ~5-15% over fair value by traditional metrics. So a return to fair value — even a 15% drop in 2011 — still means the worst is (was) behind us.
If houses were to careen far below fair value — they were about 40% overvalued, so in theory, they could overshoot 40% to the downside — then my valuation thesis would be wrong. There are lots of ways house prices could drop much further: If jobs and income plummet from here, home prices will be too high. If interest rates spike, prices will adjust downward. If the mortgage deduction were to be eliminated, prices fall also. IMO, these are smaller possibilities — say 20-25% chance — then merely mean reverting towards historic relationships with median income, cost of renting, and home equity as a percentage of GDP.
Jobs, Income, cost of renting, the mortgage tax deductions, desire for specific school districts, and myriad other factors have typically provided a relationship between home prices and fair value. Assuming that these traditional elements continue to have force, then prices may be less likely to careen past fair value the way equities do when they mean revert. Psychology has an impact, but the insanity seems to be more tempered with Houses than it is with stocks, likely to due the transactions costs and time lag of buying and selling real estate versus instant stock transactions.
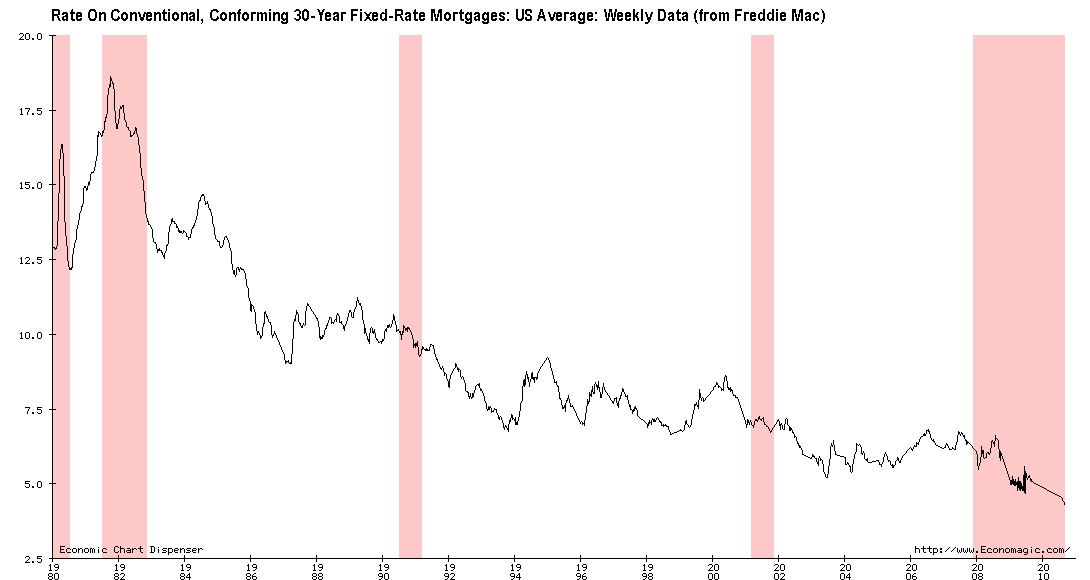
The ultra low rates and abdication of lending standards are why prices went into orbit. Lending standards have tightened, but rates remain low. These headwinds are why I expect future appreciation to be modest at best over the next decade.
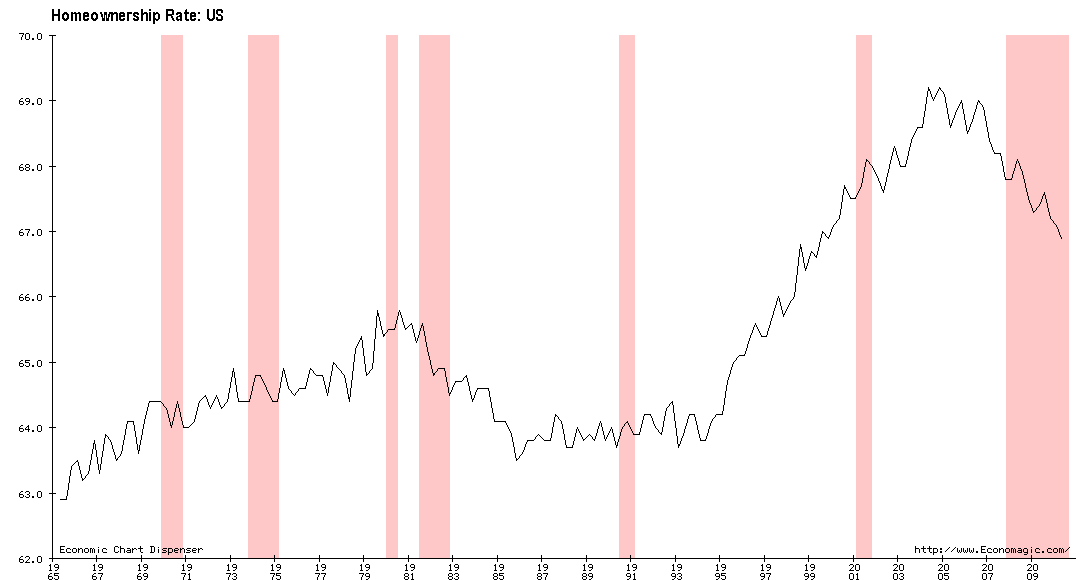
For some context, consider these three long term charts:
>
US Median Prices of Houses Sold
Source: Economagic
Interest Rates Conforming 30 Year Fixed Mortgages
Source: Economagic
US Home Ownership Rates

Source: Economagic
>
Previously:
A Closer Look at the Second Leg Down in Housing (June 24th, 2010)
Cost of Home Ownership (February 23rd, 2010)


What's been said:
Discussions found on the web: