Yesterday, Peter Boockvar referenced two WSJ articles on P/E: The Decline of the P/E Ratio and Is It Time to Scrap the Fusty Old P/E Ratio?
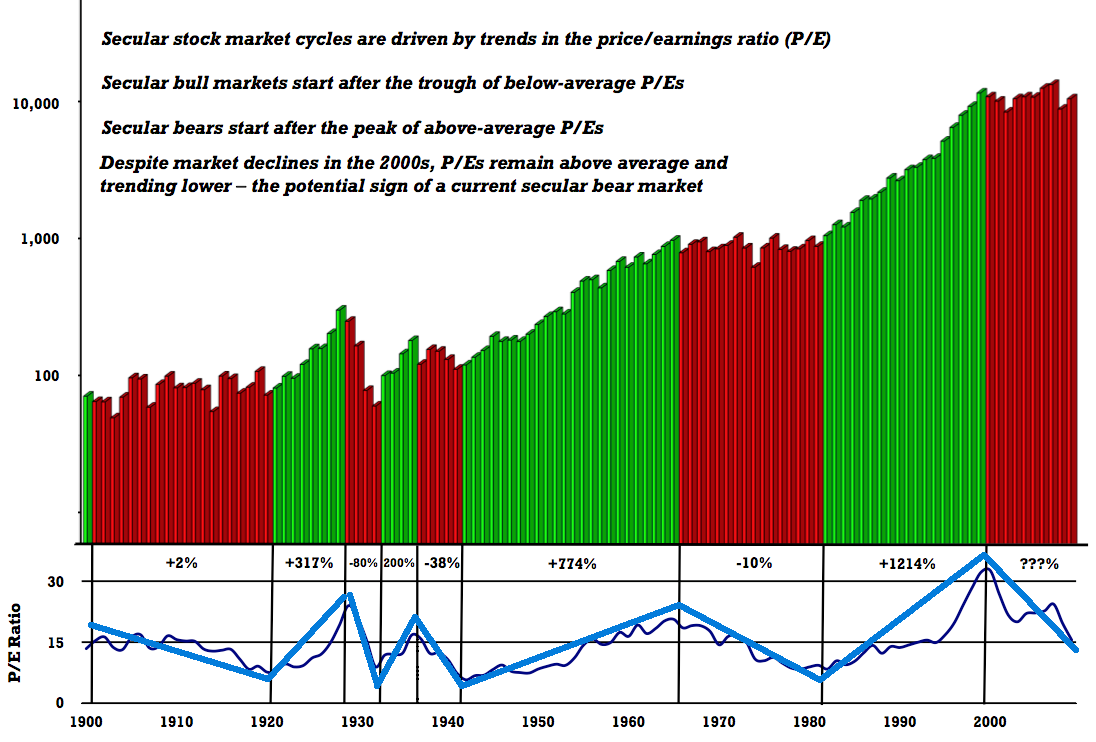
I believe these articles are asking the wrong question. Rather than wondering if the value of P/E ratio is fading, the better question is, “What does a falling P/E ratio mean?” The chart below will help answer that question.
We can define Bull and Bear markets over the past 100 years in terms of P/E expansion and contraction. I always show the chart below when I give speeches (from Crestmont Research, my annotations in blue) to emphasize the impact of crowd psychology on valautions.
Consider the message of this chart. It strongly suggests (at least to me) the following:
Bull markets are periods of P/E expansion. During Bulls, investors are willing to pay increasingly more for each dollar of earnings;
Bear markets are periods of P/E contraction. Investors demand more earnings for each dollar of share price they are willing to pay.
Hence, a falling P/E ratio is not indicia of its lack of utility. Nor is it proof of “Fustyness.” Rather, it suggests that crowd is still feeling burned by the recent collapse in prices and increase in volatility.
Thus, this is not about the market’s economic concerns, or sustainability of earnings. It is about psyche.
The 2008-09 crash follows (in order) the 2000 dot com implosion, the commodity boom and bust, and the Real Estate debacle. Is it any wonder investors are nervous? Their skittishness requires additional incentives to get them to purchase risk assets like stocks. Hence, the decreasing cost of owning equities as a natural result of the psychic pain of losses, still fresh in investor memories.
History teaches us that valuations typically become extremely attractive at the end of Bear markets. The P/E ratio — as well as the dividend yield, enterprise-value-to-free-cash-flow ratio,
>
100 Years of Secular Markets, P/E Expansion & Contraction
click for ginormous chart

Source: Crestmont Research


What's been said:
Discussions found on the web: