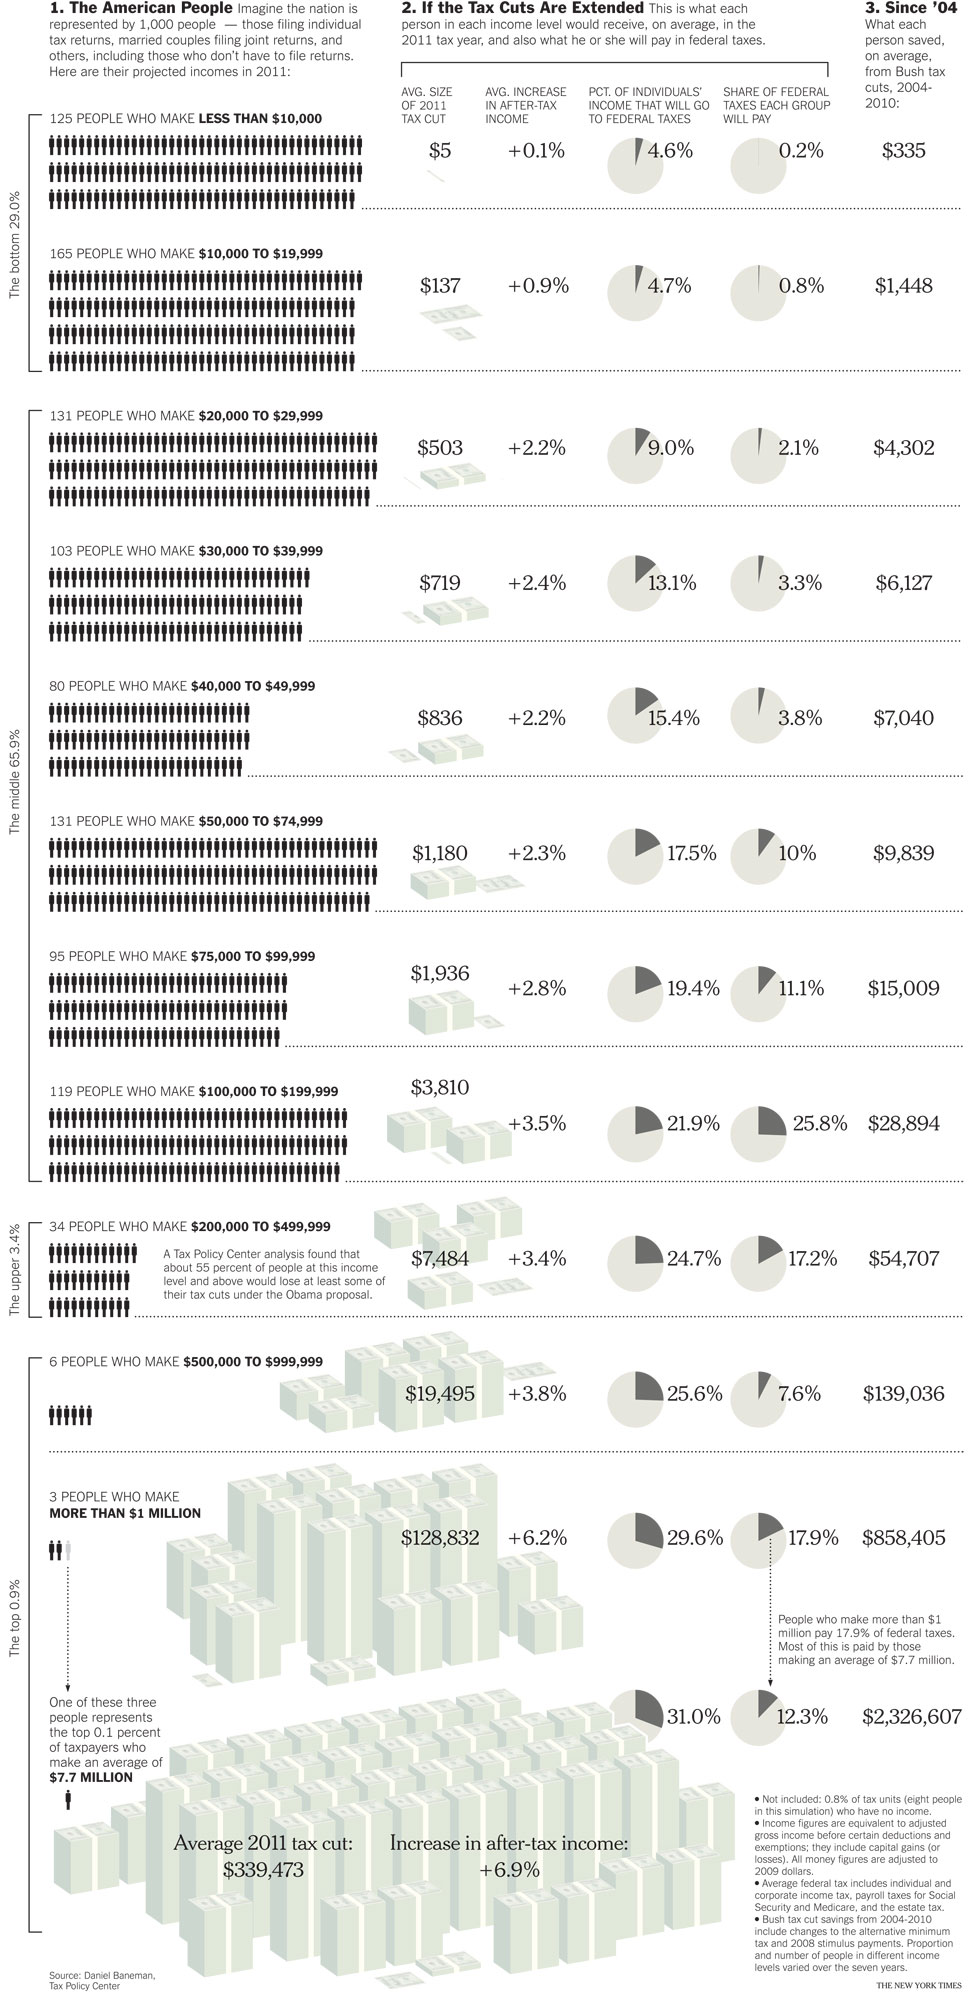
The NYTimes graphic department has your Sunday morning chart porn regarding the extension of tax cuts. Its an illustration fueled by data from the Tax Policy Center, a nonpartisan research organization.
The graphic shows how much Americans have gotten so far broken down by income groups. And it calculates that extending all of the Bush Tax Cuts for the next decade will cost another $2.7 trillion (through 2020).
Here is a guide to who will get what if the cuts are extended, and who got what from the last seven years of cuts:
>
click for larger graphic

Courtesy of the NYT
>
Source:
Your Coming Tax Cut (or Not)
BILL MARSH
NYT, September 18, 2010
http://www.nytimes.com/interactive/2010/09/19/weekinreview/19marsh.html


What's been said:
Discussions found on the web: