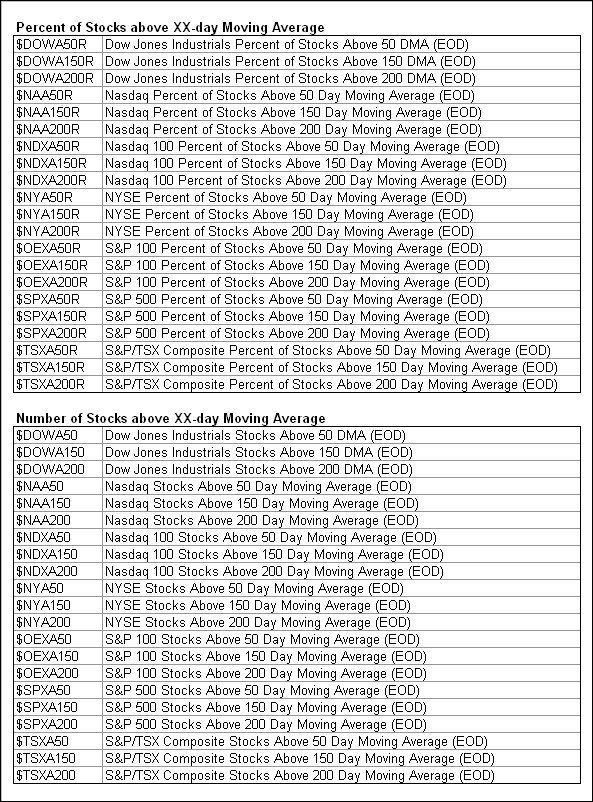
I was discussing with a group of traders the other day how to use various oscillators with a moving average. Percentage of NYSE stocks over the 200 day MA, percent of SPX stocks over 50 day, etc.
Someone complained that when they didn’t have access to their Bloomberg terminal, they could not pull up those charts.
Thanks to Stockcharts.com, that turns out not to be the case. Here are a variety of MAs on Nasdaq, NYSE, S&P500 and TSX exchanges:
>


What's been said:
Discussions found on the web: