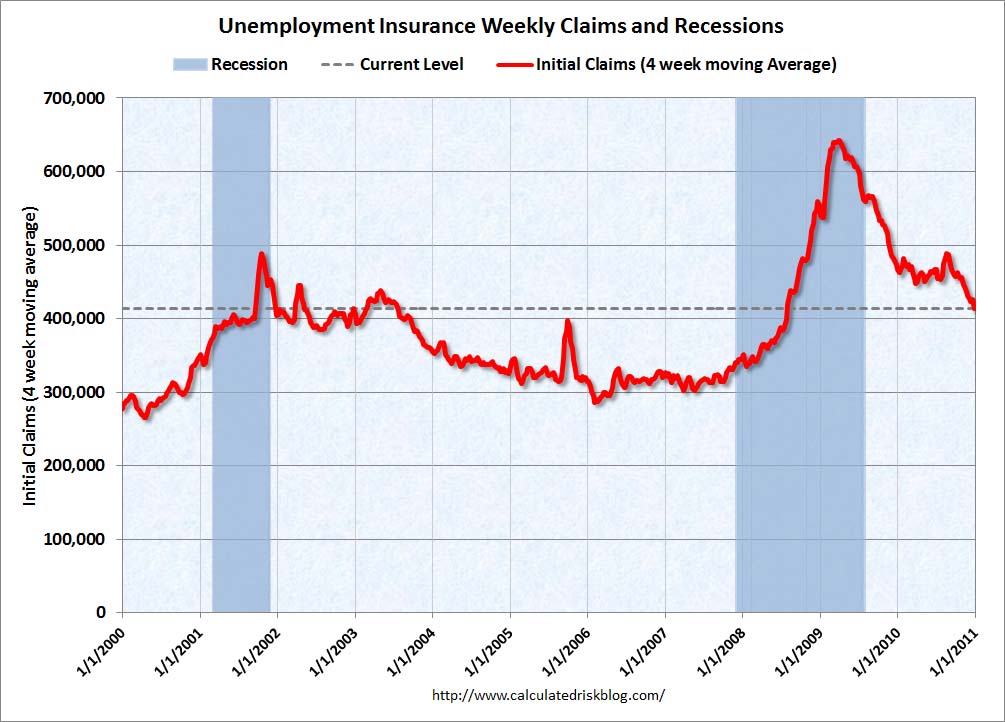
Claims for jobless benefits dropped to the lowest level in ore than two years, falling below the crucial 400k level. The four-week average, which smooths out the data series, and fell to 414,000.
The traditional interpretation suggests that the U.S. labor market, which has been a headwind for the economy, is improving as the economy slowly accelerates into the new year. New applications for unemployment assistance decreased by 34,000 to 388,000 (week ending December 25th). That is the lowest level since July 2008.
How could I not make this our Chart of the Day?
>
click for larger chart

Chart courtesy of Calculated Risk
>
Here is the official US Department of Labor announcement:
“In the week ending Dec. 25, the advance figure for seasonally adjusted initial claims was 388,000, a decrease of 34,000 from the previous week’s revised figure of 422,000. The 4-week moving average was 414,000, a decrease of 12,500 from the previous week’s revised average of 426,500.
The advance seasonally adjusted insured unemployment rate was 3.3 percent for the week ending Dec. 18, an increase of 0.1 percentage point from the prior week’s unrevised rate of 3.2 percent.
The advance number for seasonally adjusted insured unemployment during the week ending Dec.18 was 4,128,000, an increase of 57,000 from the preceding week’s revised level of 4,071,000. The 4-week moving average was 4,120,000, a decrease of 37,250 from the preceding week’s revised average of 4,157,250.”


What's been said:
Discussions found on the web: