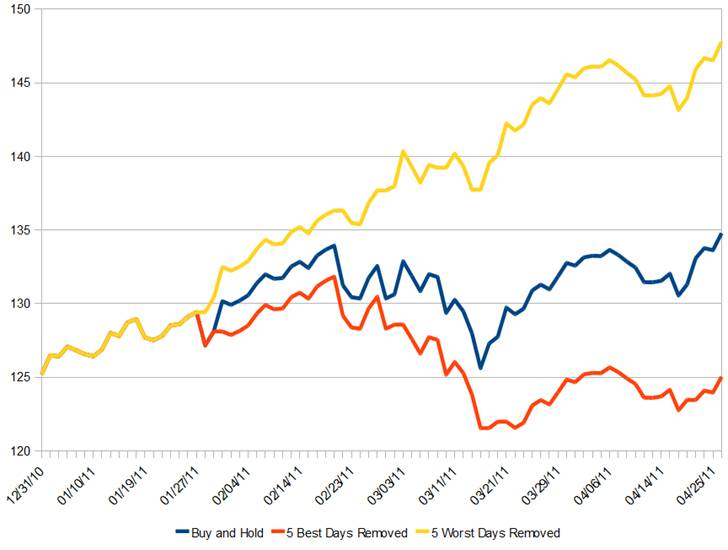
It has been a while since we last showed a Best & Worst days chart, so we are overdue for another update.
Today’s version is courtesy of Mike Gayed of Pension Partners, and it shows what your returns look like if you were merely a Buy & Hold investor, if you were unlucky enough to miss the 5 best days, or lucky enough to avoid the 5 worst ones:
>
Missing the 5 Best/Worst Days, S&P500
>
Previously:
Missing Best & Worst Days of S&P500 (September 2010)


What's been said:
Discussions found on the web: