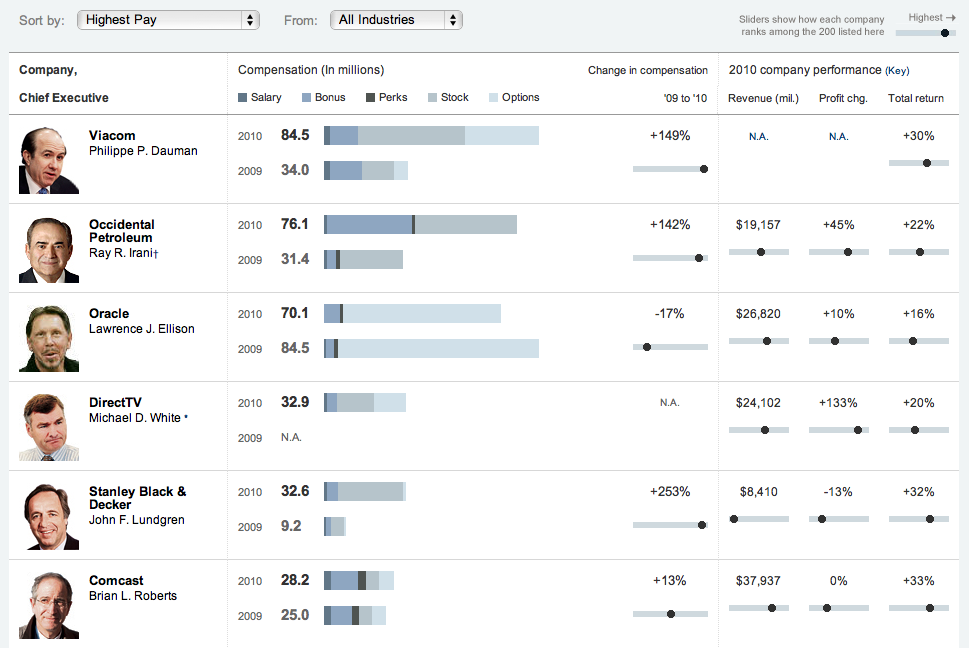
Following our QOTD is this interactive graphic from the Sunday NYT showing the relative compensation of 200 chief executives:
>
click for interactive graphic

>
Source:
The Drought Is Over (at Least for C.E.O.’s)
DANIEL COSTELLO
NYT, April 9, 2011
http://www.nytimes.com/2011/04/10/business/10comp.html


What's been said:
Discussions found on the web: