Some of the factors that have landed us in the mess we’re in have been building for decades, and there’s ample evidence on which to draw to demonstrate that fact. In looking at a few of these issues, I’ll draw on some charts I’ve presented both here and elsewhere before. A couple are replicated from this outstanding study in January’s Monthly Labor Review (MLR).
Let’s begin by referencing a recent piece by Stephen Roach that accurately assesses what’s really wrong with our current economy, summed up in one number:
The number is 0.2%. It is the average annualized growth of US consumer spending over the past 14 quarters – calculated in inflation-adjusted terms from the first quarter of 2008 to the second quarter of 2011. Never before in the post-World War II era have American consumers been so weak for so long. This one number encapsulates much of what is wrong today in the US – and in the global economy.
Here’s a graphic representation of what Mr. Roach is talking about:
We’ve gone, 14 quarters from the start of the recession, from an index value of 100 to a current index value of 100.7, which is an average annualized growth rate of 0.2 percent. Anemic. Given that consumer spending represents some 70 percent of GDP, a wobbly consumer — note the flatline over the past two quarters — is problematic. And at the risk of turning blue in the face, I’d point out yet again that we know small businesses cite “Poor Sales” as their number one single biggest problem. So, to the extent very little (anything?) has been done to help the consumer, the mess in which we find ourselves should come as absolutely no surprise. Corporations, which are flush with cash, are spending that cash on such things as mergers, acquisitions, share buybacks, and dividend hikes. While that’s all well and good for the investor class, it does virtually nothing for Joe Six Pack on Main St.
That said, let’s peel the onion a bit and look at factors that are behind the our weak consumer.
First up, Labor Share, which the MLR defines as:
Labor share is the portion of output that employers spend on labor costs (wages, salaries, and benefits) valued in each year’s prices. Nonlabor share—the remaining portion of output—includes returns to capital, such as profits, net interest, depreciation, and indirect taxes.
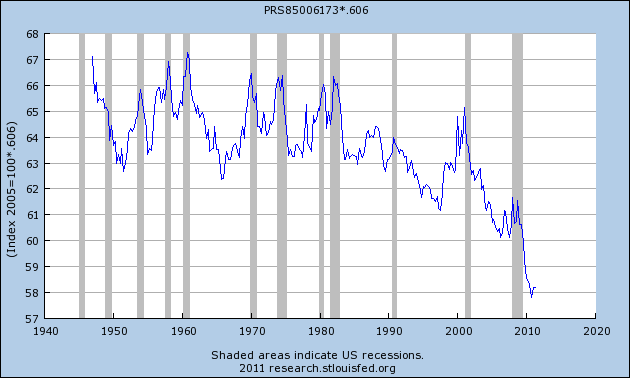
Here’s what has become of Labor Share:
(NOTE: BLS provides (and FRED captures) this series as an Index, not a Level, with 2005 = 100. BLS advises me that the 2005 Level = 60.6. Therefore, I have taken the entire Index (Series identified above) and multiplied it by .606 to get the percent Labor Share above. It continues to bewilder me that more is not made of this troubling metric.)
As the MLR points out:
Labor share averaged 64.3 percent from 1947 to 2000. Labor share has declined over the past decade, falling to its lowest point in the third quarter of 2010, 57.8 percent. The change in labor share from one period to the next has become a major factor contributing to the compensation–productivity gap in the nonfarm business sector.
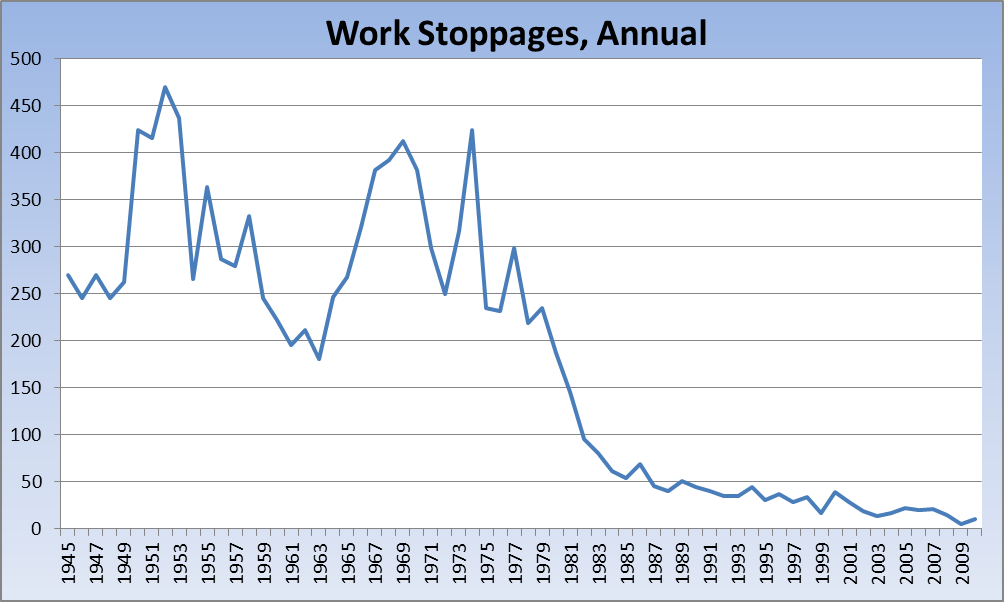
The decline in Labor Share can also be looked at in the context of the growing impotence of unions in the United States, as well as declining union membership (for which I could not find an adequate chart). Here is a chart showing the number of work stoppages annually since 1947:
While Labor Share has recently plummeted to all-time lows since record keeping began, Median Household Income has stagnated for the past 12 years. In the last recession (2001), incomes had only begun to decline. I’m sure back then no one contemplated the possibility that the decline would last (certainly not for a decade), credit was still widely available and, as we know now, being freely tapped (see the PCE chart above for evidence of how normal consumer spending remained during that period). One decade later, Labor Share has collapsed, incomes have gone nowhere, and credit availability — to say nothing of consumers’ attitudes toward it — has all but vanished except for the most creditworthy.
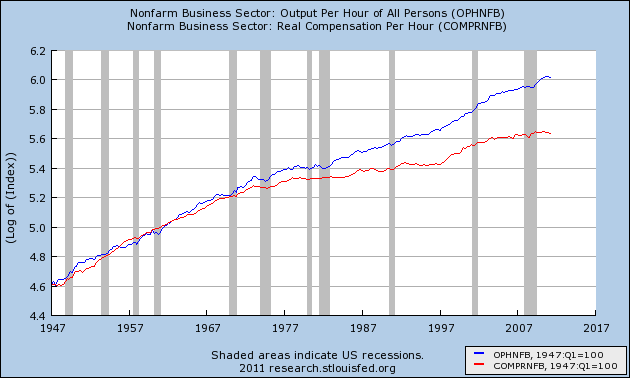
To add insult to injury, Output — or Productivity — has far outstripped Compensation since ’70s, no doubt due in very large part to advances in technology. The gap is even wider in the manufacturing sector of the economy (see Chart 6 in the MLR study). Producing more for less and with less has become a hallmark of good corporate management at the expense, of course, of the American worker. It is a lynchpin of the great American mantra of “maximizing shareholder value.”
The chart below is a natural log chart (which should please the readers who have occasionally suggested the use of log charts) in which both metrics were indexed to 100 at the earliest measurement .
There may — operative word “may” — be a glimmer of hope on the horizon for consumers, though I think it’s fair to say the administration’s previous forays into the housing market have been generally ineffective. I’ll outsource some commentary and number crunching to David Rosenberg:
Finally, at a time when we are all looking for Bernanke for a solution to the economy’s woes, there is a push for something potentially exciting for the housing market that does not require an FOMC meeting or a congressional vote for that matter. Have a look at U.S. May Back Refinance Plan For Mortgages on the front page of the NY Times. Now this is a proposal that may work — allowing the millions of homeowners who currently do not qualify for a mortgage refinancing the opportunity to do so. There is an estimated $2.4 trillion in mortgages that are currently yielding over 4.5% (and rates are at 4%). This plan would potentially free up $85 billion in cash flow for mortgage households, and that is equivalent to a 1% pay hike. […]
The bottom line is the lack of refinancing response to lower rates has been a huge transfer of wealth from homeowners and government (they have credit risk) to holders of agency MBS. An effective refinancing program would level the playing field and would be a very effective policy tool and accentuate the impact of the Fed’s ultra low rate policy in terms of the transmission mechanism for the mortgage market. This could end up being big in terms of releasing vital cash flow to the household sector at a time of still-soft labour market conditions. Who ends up getting hurt? In all likelihood, MBS holders (holders of higher coupon MBS) would be the victims, but for a good social cause, don’t you think?
I’d hasten to point out that there are doubts about the plan over at Calculated Risk.
We are now squarely face-to-face with the consequences of the decades long gutting of the middle class that was the backbone of our economy for so long. Without taking some solid, clearly-defined steps, the middle class will undoubtedly move from an endangered species to extinction. The tipping point may already have been passed and, even if it hasn’t, I’m still not optimistic there’s any interest in D.C. to make the requisite policy changes.
On a somewhat related note as Irene barrels up the eastern seaboard and warnings of widespread power outages are sent far and wide, I can’t help but wonder (yet again) why no consideration is ever given to burying our power lines in the northeast. Is it too common sense, too potentially stimulative, too money-saving in the long run, or all three?


What's been said:
Discussions found on the web: