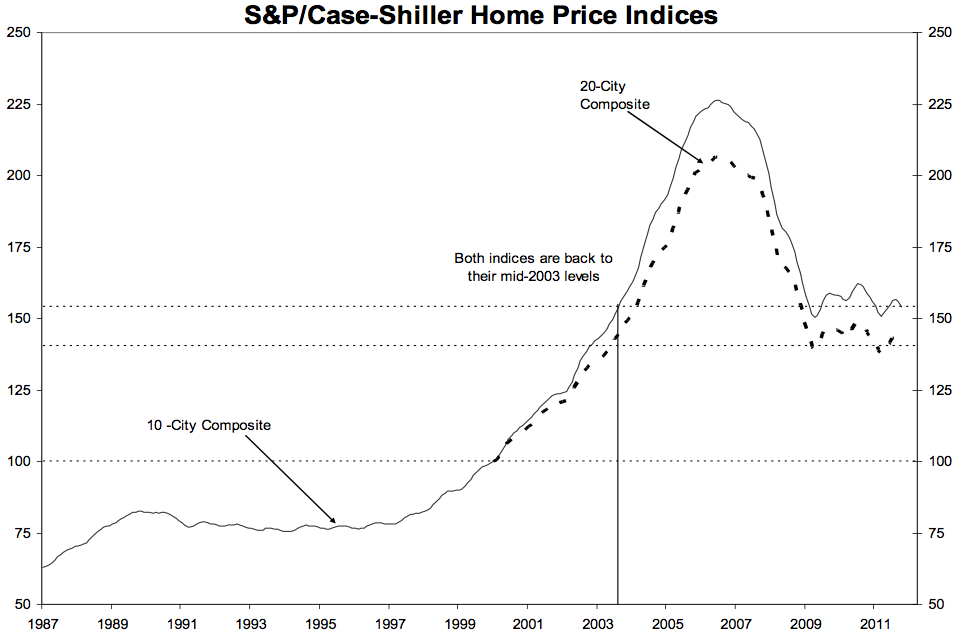
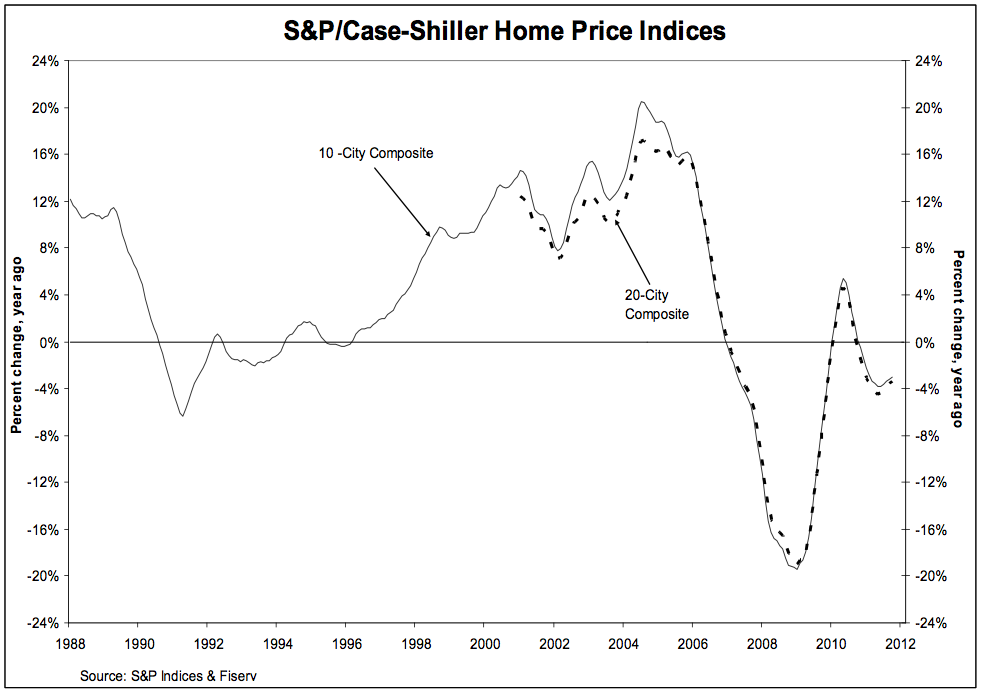
U.S. home prices fell ~1.2% respectively in October versus September, with 19 of 20 cities covered by the indices decreasing over the month. Year over year drops of the 10- and 20-City Composites fell -3.0% and -3.4% respectively versus October 2010.
As of October 2011, average home prices across the U.S. are back to their mid-2003 levels. (See chart below) Measured from their June/July 2006 peaks, the peak-to-current declines for the 10-City Composite & 20-City Composite are -31.9% and -32.1%, respectively.
>
click for larger chart

Source: S&P Case Shiller
>
More charts after the jump
>
~~~
Year over Year Percentage Price Change in Case Shiller Home Price Index

>
~~~


What's been said:
Discussions found on the web: