>
Bloomberg.com – Volatile DJIA Preoccupied With Euro Crisis
Never before has the euro influenced U.S. stocks as much as this year, a sign that American equities aren’t going anywhere until Europe’s credit crisis is solved.The link between the Dow Jones Industrial Average and swings in the currency reached a record on Dec. 2, according to data compiled by Bloomberg. The so-called correlation coefficient showing how much two markets rise and fall in tandem hit 0.85, the highest level since the euro was founded in 1999, data on 60-day rolling averages show. A reading of 1 means assets are moving in lockstep. Speculation about whether Greece, Ireland and Portugal will avoid default is drowning out results from companies . . .
MarketWatch.com – From America to Asia, we’re all in the euro zone
What happens in Europe won’t stay in Europe European summits – more than 20 at last count — have produced little. The planned summit on Dec. 9 may well be the last chance for euro leaders and Euro-crats to avoid financial disaster. Unless European leaders overcome their common sense deficit, as intractable as some budget and trade deficits, this may not end well. What happens in Europe will not stay in Europe. The shock will be rapidly transmitted through trade, investment and the financial system to the rest of the world. Problems in international money markets will not be welcome for American businesses or the federal government, which relies on foreign investors for financing. It may truncate the nascent U.S. economic recovery. Not just Americans’ financial health and savings will be affected by what happens in Europe. If the International Monetary Fund (”IMF”) gets involved, Americans will bear around 16% of the bill for any European bailout.
Comments:
The high degree of correlation in the markets is a topic we have covered extensively as of late. The market is not being driven by individual stock fundamentals, but rather by macro themes that dominate the investing landscape.
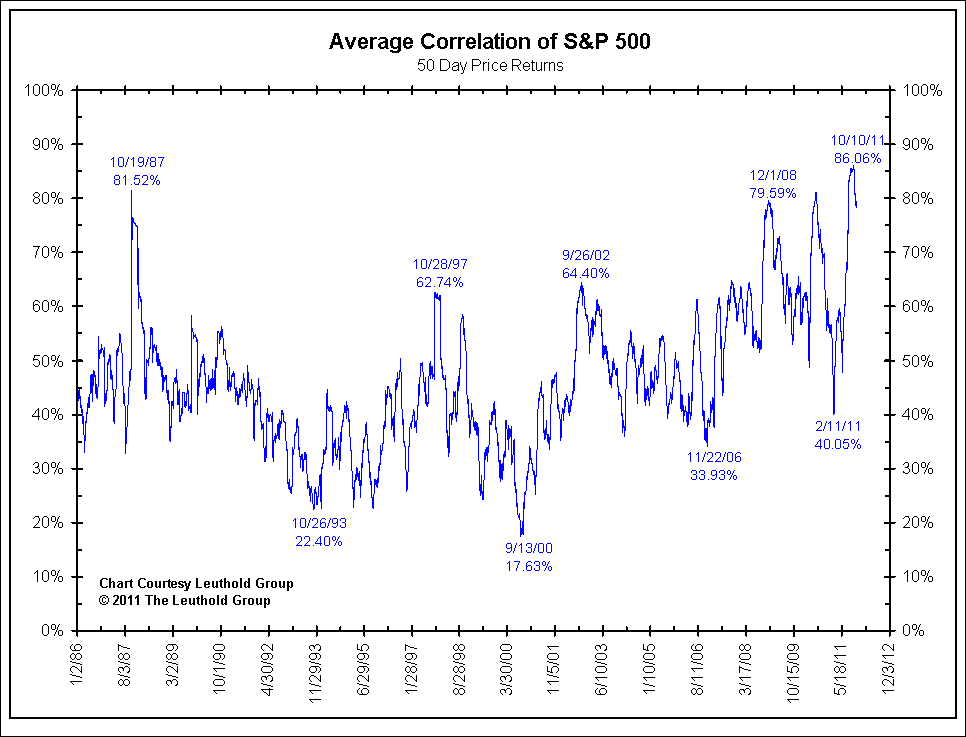
If one correlates each of the individual stocks in the S&P 500 to the index itself over a 50 day period, the average correlation hit 86% in October and is still near 80% today. No other period since the inception of the index has yielded a higher correlation, not during the Great Depression, rampant inflation of the 1970s, the stock market crash of 1987 or even during the financial crisis of 2008. This suggests 80% of a stock’s movement can be explained by a stock market index rallying or declining. The other 20% of a stock’s movement can be explained by the unique fundamental characteristics of that company such as management, product, a strategic plan and/or financial health. Similar record correlations can be found between the S&P 500 and currencies (the euro), commodities (crude oil), foreign markets (emerging market and European stocks) as well as interest rates (corporate and Treasury yields).
In the entire history of the S&P 500, there has never been a day in which all 500 stocks in the index go up or all 500 go down. There have been 11 days in which 490+ stocks all move in the same direction on a given day. Of those 11 instances, 6 have occurred since July 2011.
Add this all up and it appears as though macro themes, such as government intervention in the marketplace, will dictate returns. For the time being, stock picking is a dead art form and diversification is a largely unattainable goal.
Source: Arbor Research


What's been said:
Discussions found on the web: