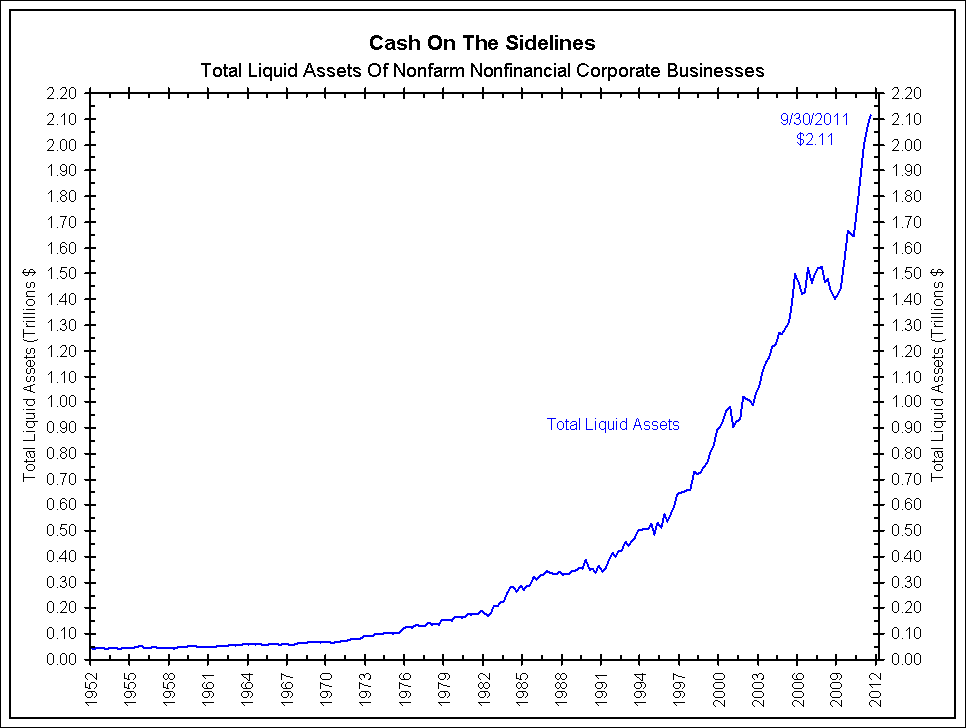
Yesterday the Federal Reserve released its quarterly Flow of Funds data, current through September 2011. One of the more popular headlines from this data concerns the record amount of “cash on the sidelines“. Through Q3 2011, nonfarm nonfinancial corporate businesses held $2.11 trillion in liquid assets on their balance sheets. As the argument goes, this must be a sign of pent-up demand just waiting to be unleashed on the market.
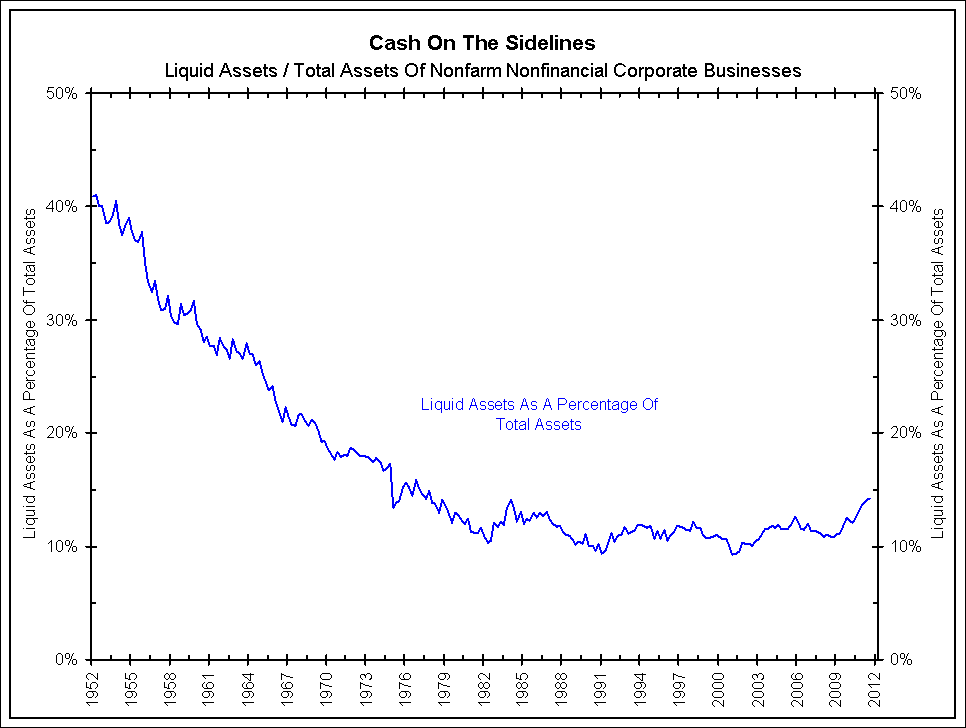
Liquid assets held on companies’ balance sheets is a nominal number, much like the nominal level of GDP, that rarely decreases. Of course cash on the sidelines is at a record nominal level, it usually is. This series must be compared to other balance sheet items for relevance. The chart below shows liquid assets as a percentage of total nonfarm nonfinancial corporate business assets since 1952. By this measure, the “cash on the sidelines” argument is far less compelling.
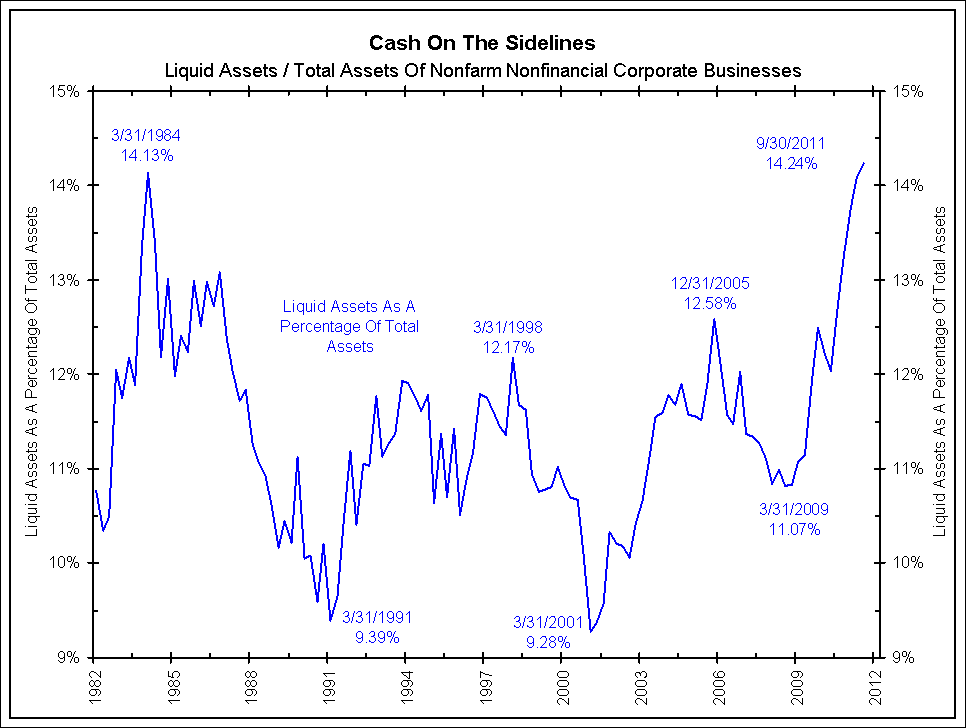
When examined over a shorter time frame, as shown below, the percentage of cash on the sidelines is at the upper end of its range of the past 30 years. Given the uncertainty in the markets, rampant volatility and the lack of good investment opportunities, this should not come as a surprise.
While it is true that cash on the sidelines, as defined above, is at its highest level in roughly 30 years, should this be taken as a sign of pent-up demand that could lead to a huge rally once unleashed? We would still argue it is not. If and when investment opportunities become more enticing, we will see these levels fall from 14.24% to the historical norm of the past 30 years of 10%-11%. It is not as though companies currently have 40% of their assets in the form of cash waiting to be invested, as was the case in the 1950s.
Source: Arbor Research


What's been said:
Discussions found on the web: