Couple of interesting points from the report are:
• Overall, the deleveraging process has only just begun. During the past two and a half years, the ratio of debt to GDP, driven by rising government debt, has actually grown in the aggregate in the world’s ten largest developed economies
• Private-sector debt has fallen, however, which is in line with historical experience: overextended households and corporations typically lead the deleveraging process; governments begin to reduce their debts later, once they have supported the economy into recovery
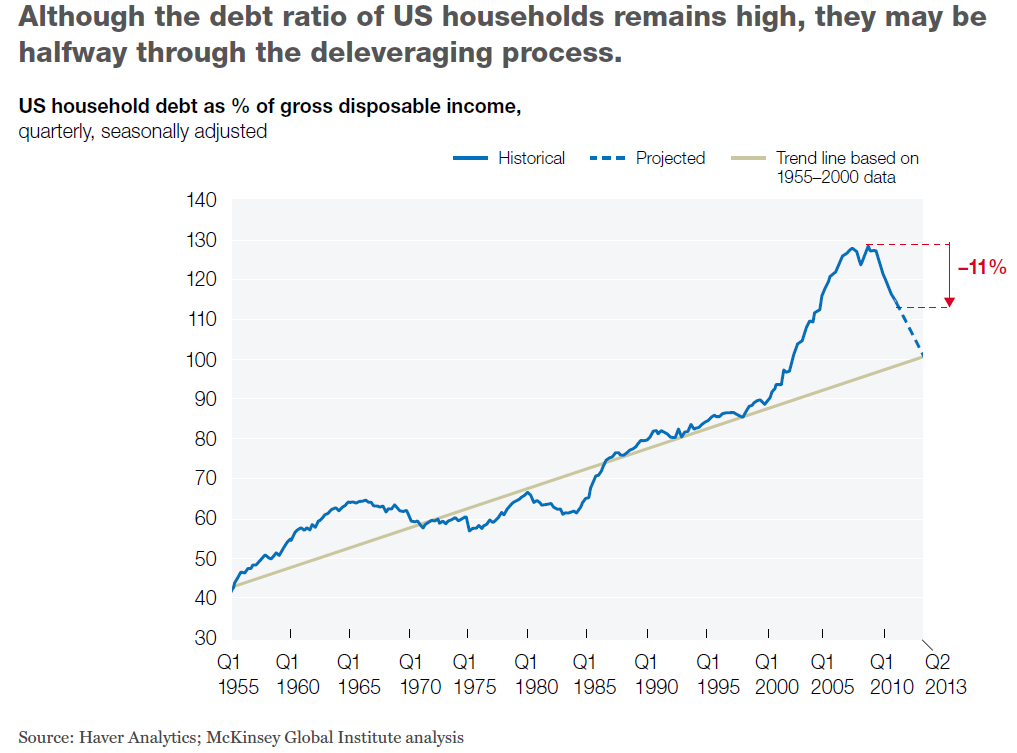
• Historical precedent suggests that US households could be up to halfway through the deleveraging process, with one to two years of further debt reduction ahead. We base this estimate partly on the long-term trend line for the ratio of household debt to disposable income. Americans have constantly increased their debt levels over the past 60 years, reflecting the development of mortgage markets, consumer credit, student loans, and other forms of credit. But after 2000, the ratio of household debt to income soared, exceeding the trend line by about 30 percentage points at the peak (Exhibit 1). As of the second quarter of 2011, this ratio had fallen by 11 percent from the peak; at the current rate of deleveraging, it would return to trend by mid-2013. Faster growth of disposable income would, of course, speed this process.
Highlighted part:
Historical experience suggests that excessive debt is a drag on growth and that GDP rebounds in the later years of deleveraging.
Overall, the deleveraging process has only just begun. During the past two and a half years, the ratio of debt to GDP, driven by rising government debt, has actually grown in the aggregate in the world’s ten largest developed economies. Private-sector debt has fallen, however, which is in line with historical experience: overextended households and corporations typically lead the deleveraging process; governments begin to reduce their debts later, once they have supported the economy into recovery.
Household debt outstanding has fallen by $584 billion (4 percent) from the end of 2008 through the second quarter of 2011 in the United States. Defaults account for about 70 and 80 percent of the decrease in mortgage debt and consumer credit, respectively.
It is estimated that up to 35 percent of the defaults resulted from strategic decisions by households to walk away from their homes, since they owed far more than their properties were worth. In 11 of the 50 states— including hard-hit Arizona and California—mortgages are nonrecourse loans, so lenders cannot pursue the other assets or income of borrowers who default.
Historical precedent suggests that US households could be up to halfway through the deleveraging process, with one to two years of further debt reduction ahead.
As of the second quarter of 2011, this ratio had fallen by 11 percent from the peak; at the current rate of deleveraging, it would return to trend by mid-2013.
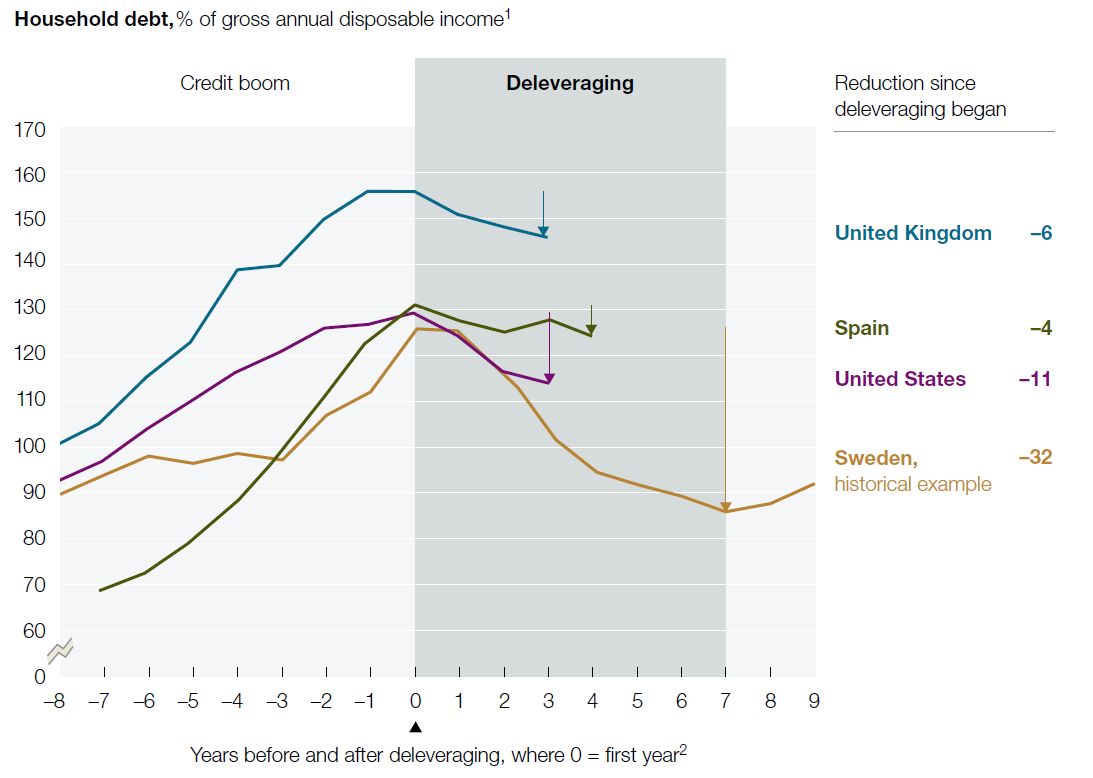
We came to a similar conclusion when we compared the experiences of US households with those of households in Sweden and Finland in the 1990s. During that decade, these Nordic countries endured similar banking crises, recessions, and deleveraging. In both, the ratio of household debt to income declined by roughly 30 percent from its peak.
As for the debt service ratio of US households, it’s now down to 11.5 percent—well below the peak of 14.0 percent, in the third quarter of 2007, and lower than it was even at the start of the bubble, in 2000.
Nonetheless, after US consumers finish deleveraging, they probably won’t be as powerful an engine of global growth as they were before the crisis. That’s because home equity loans and cash-out refinancing, which from 2003 to 2007 let US consumers extract $2.2 trillion of equity from their homes—an amount more than twice the size of the US fiscal-stimulus package—will not be available.
Three years after the start of the financial crisis, UK households have deleveraged only slightly, with the ratio of debt to disposable income falling from 156 percent in the fourth quarter of 2008 to 146 percent in second quarter of 2011.
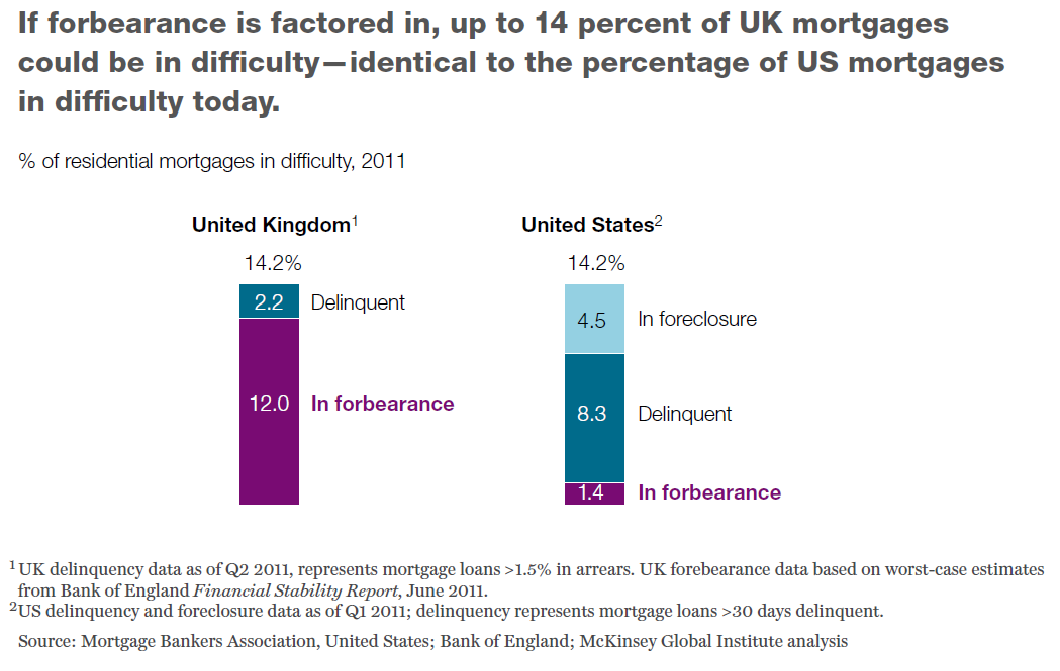
The Bank of England estimates that up to 12 percent of them may be in some kind of forbearance process, and an additional 2 percent are delinquent— similar to the 14 percent of US mortgages that are in arrears, have been restructured, or are now in the foreclosure pipeline.
Some 23 percent of UK households report that they are already “somewhat” or “heavily” burdened in paying off unsecured debt.
This statistic is particularly problematic because at least two-thirds of UK mortgages have variable interest rates, which expose borrowers to the potential for soaring debt payments should interest rates rise.
Extrapolating the recent pace of UK household deleveraging, we find that the ratio of household debt to disposable income would not return to its long-term trend until 2020.
Since the credit crisis first broke, Spain’s ratio of household debt to disposable income has fallen by 4 percent and the outstanding stock of household debt by just 1 percent.
Almost half of the households in the lowest-income quintile face debt payments representing more than 40 percent of their income, compared with slightly less than 20 percent for low-income US households. Meanwhile, the unemployment rate in Spain is now 21.5 percent, up from 9 percent in 2006.
Although the private sector may start to reduce debt even as GDP contracts, significant public-sector deleveraging, absent a sovereign default, typically occurs only when GDP growth rebounds, in the later years of deleveraging.
As relatively small economies deleveraging in times of strong global economic expansion, Finland, South Korea, and Sweden could rely on exports to make a substantial contribution to growth.
The decisive resolution of bad loans was critical to kick-start lending in the economic rebound phase of deleveraging.
A continuation of the Eurozone crisis, however, poses a risk of a significant credit contraction in 2012 if banks are forced to reduce lending in the face of funding constraints. Such a forced deleveraging would significantly damage the region’s ability to escape recession.
The United States, for instance, ought to streamline and accelerate regulatory approvals for business investment, particularly by foreign companies. The United Kingdom should revise its planning and zoning rules to enable the expansion of successful high-growth cities and to accelerate home building. Spain should drastically simplify business
regulations to ease the formation of new companies, help improve productivity by promoting the creation of larger ones, and reform labor laws.
In Sweden and Finland, exports grew by 10 and 9.4 percent a year, respectively, between 1994 and 1998, when growth rebounded in the later years of deleveraging. This boom was aided by strong export oriented companies and the significant currency devaluations that occurred during the crisis (34 percent in Sweden from 1991 to 1993). South Korea’s 50 percent devaluation of the won, in 1997, helped the nation boost its share of exports in electronics and automobiles.
During the three historical episodes discussed here, the housing market stabilized and began to expand again as the economy rebounded.
In the United States, new housing starts remain at roughly one-third of their long-term average levels, and home prices have continued to decline in many parts of the country through 2011. Without price stabilization and an uptick in housing starts, a stronger recovery of GDP will be difficult, since residential real-estate construction alone contributed 4 to 5 percent of GDP in the United States before the housing bubble.
And new McKinsey Global Institute research shows that the unwinding of debt—or deleveraging—has barely begun. Since 2008, debt ratios have grown rapidly in France, Japan, and Spain and have edged downward only in Australia, South Korea, and the United States. Overall, the ratio of debt to GDP has grown in the world’s ten largest economies.
Click to enlarge:
˜˜˜
˜˜˜
Source:
McKinsey Quarterly
Working Out Of Debt
January 2012


What's been said:
Discussions found on the web: