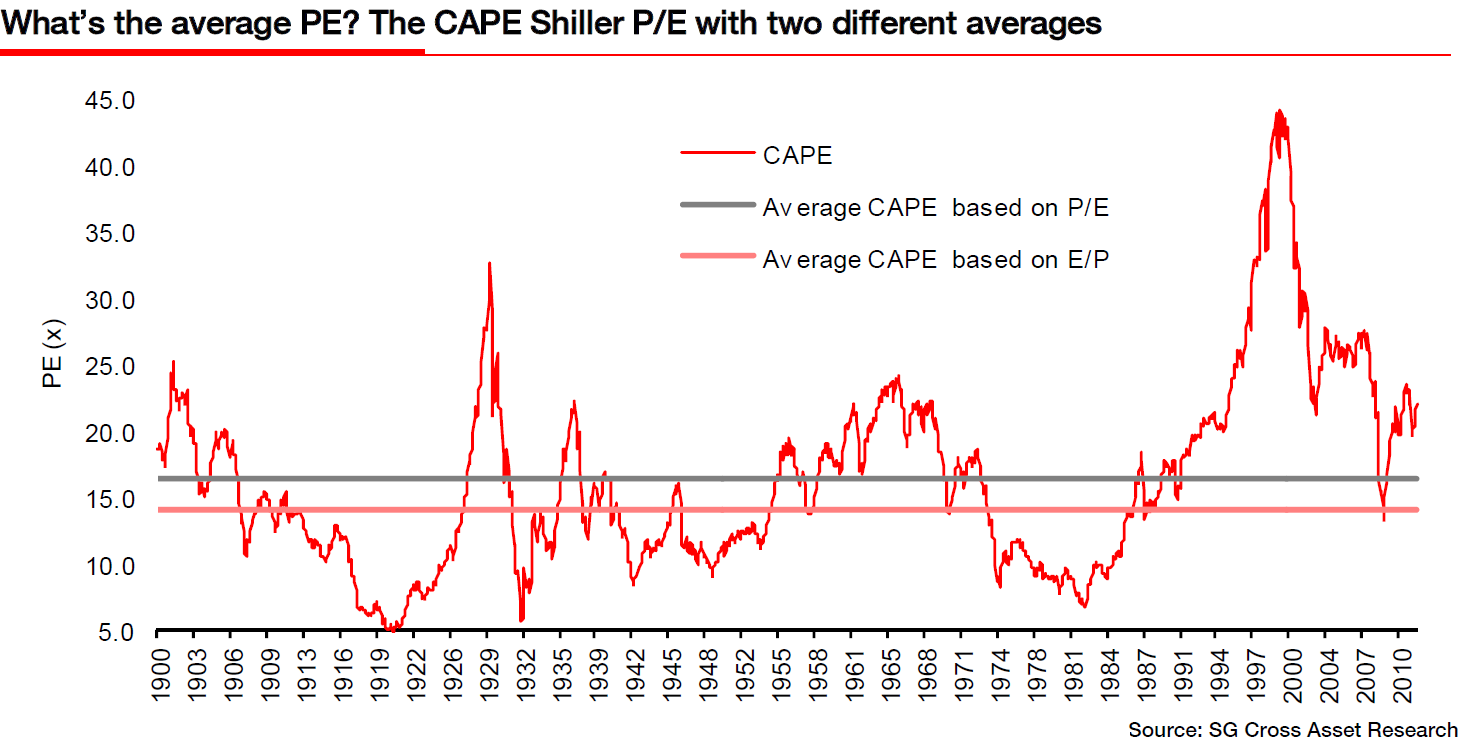
Société Générale’s Andrew Lapthorne lays out the danger of relying on P/E ratios.
“The essential message is that although one is of course simply the inverse of the other, using P/E ratio instead of earnings yields can give dramatically different results when making historical valuation comparisons.
This disparity between average P/E and average E/P is greatest where profits have a tendency to head towards zero. This has the effect of sending the P/E ratio out towards infinity, before ultimately profits turn into loss and then P/E becomes negative and hard to work with. In 2009 for example the P/E on the S&P 500 hit 146x, and as anyone who has tried to build a market valuation model for Japan will attest, the P/E ratio is not much use.
For example, taking the same price and earnings history from Robert Shiller, the average S&P 500 P/E can be either 16.5x when calculated using the average P/E, or 14x when the average is calculated more correctly by using earnings yield. This represents a massive 17% difference – see below. In the same vein therefore a dividend yield versus a history model will always produce a more pessimistic outcome than a P/E model.”
Another way to think about Earnings Yield — it allows a better reflection of companies with no earnings, and further allows a market analyst to incorporate periods when earnings are negative.
The difference between the two: The current P/E ratio of 15.4 looks historically cheap –a bout 28% undervalued; However, using Earnings Yield , the market appears fairly valued. The current yield is 6.5%, the average 6.6% making SPX 0.1% overvalued. (P/E lower is cheaper; Earnings Yield higher is cheaper)
>
Click to enlarge:

Source: Societe Generale Research
Quant Quickie, 21 March 2012


What's been said:
Discussions found on the web: