>
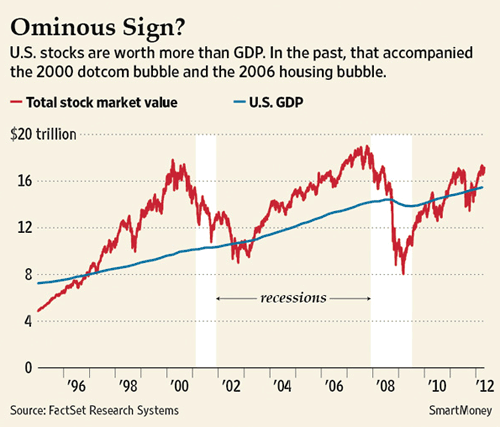
Today, I want to bring a simple analysis to your attention. It is based upon the chart of GDP versus the total stock market valuation:
Another measure bodes worse, however. That’s a comparison of the total value of U.S. shares with the yearly output of the U.S. economy (see chart). The stock market is once again the larger of the two. When that happened during a dotcom stock bubble in 2000 and during the U.S. housing bubble in 2006, the result was a stock plunge in subsequent years.
It contains several flaws worth noting.
The first is our longstanding admonition against evaluating investments against a single variable (See this, this and this). But even based on that simplistic analysis, Stocks relative to GDP are not anywhere near a danger zone.
In 2006, stocks crossed GDP at about an 8 trillion dollar capitalization.It took another 4 years and a gap of about 70% ($9.5 trillion GDP vs $17 trillion equity valuation) before the market topped out and reversed.
The same pattern held in 2003 — Equity capitalization crossed at about $11 trillion, and it took another 4 years and 70% before markets topped out near $19 trillion.
Hence, even if you want to use GDP (versus Capitalization) as your single variable, it is rather premature basis for calling the top in equities.
While there are lots of reasons to be concerned about future S&P500 gains, earnings and market cap relative to GDP isn’t one of them.
>
Previously:
Single vs. Multiple Variable Analysis in Market Forecasts (May 2005)
Understanding How to Analyze Market Metrics (July 2008)
Complexity, Context, Probability & Bias (March 2012)
Source:
Stocks Have Outgrown the Economy
Jack Hough
SmartMoney, May 02, 2012
http://blogs.smartmoney.com/advice/2012/05/02/stocks-have-outgrown-the-economy/


What's been said:
Discussions found on the web: