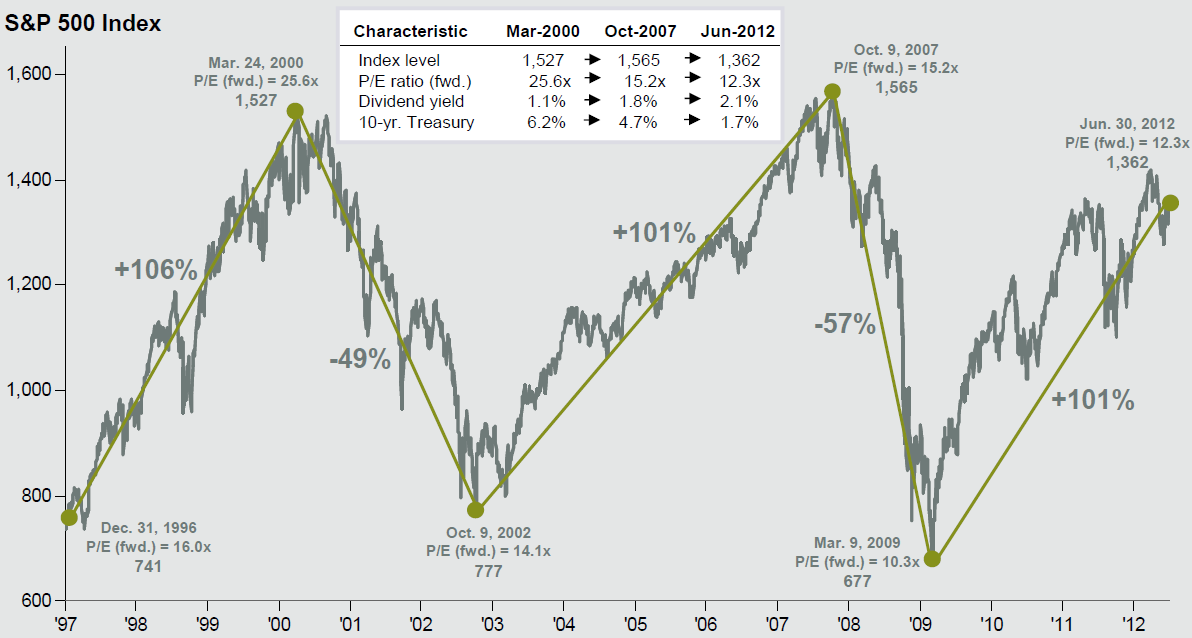
S&P 500 Index at Inflection Points
Click to enlarge:

˜˜˜
Note: If you were to use intraday peak and trough you get a number closer to 57% drop on S&P500 (recall the SPX 666 marker)
The chart showing % needed to recover losses and return to market peak after the jump . . .
This chart should be instructive for new investors and traders — the recovery from losses is not symmetrical:
Equity Scenarios: Bull, Bear & In Between

Source:
J.P Morgan Asset Management
Guide to the Markets
As of June 30, 2012


What's been said:
Discussions found on the web: