MarketWatch – Investors win as ETF wars heat up
The ETF wars are once again heating up to the benefit of everyday investors. BlackRock, the leader and pioneer of ETFs through its famous iShares products, is feeling the pressure of increased competition in the ETF space and is likely to lower their pricing.
Comment
Recently we pointed out that, despite their acceptance as an investing tool, ETF flows were still miniscule in comparison to mutual fund flows. Although equity ETF flows have generally been positive in the face of declining domestic equity mutual fund flows, they are not large enough to change the overall story being told by the data. Retail investors are still skeptical of U.S. equities and have been for many years.
Shortly after writing the aforementioned post, we began to get a lot of questions on the general makeup of the ETF world. What percentage of equity ETF flows or assets are in short-only funds? What percentage are in leveraged funds? How do the assets of US equity funds compare to those of international equity funds? How large are equity funds when compared to fixed income funds or commodity funds?
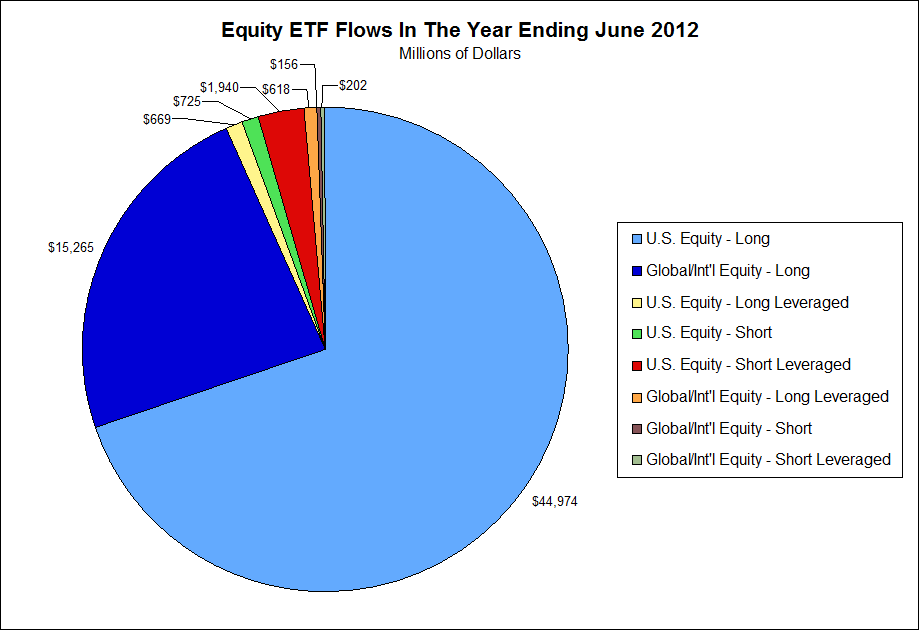
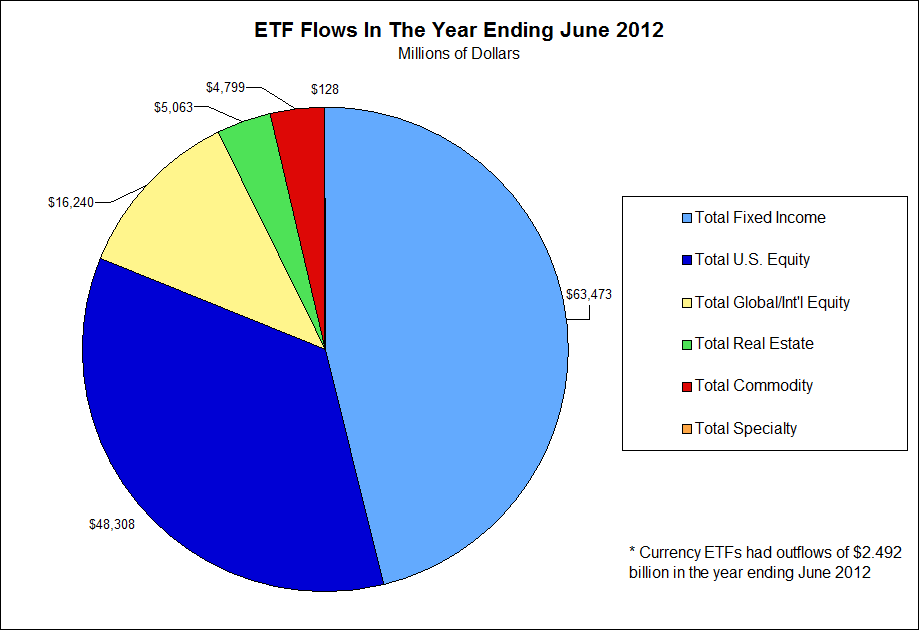
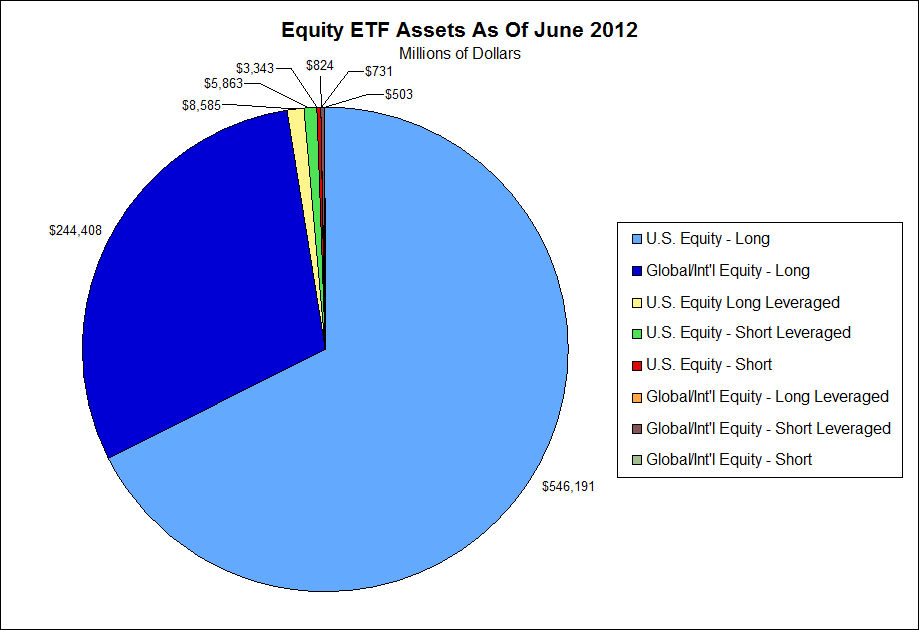
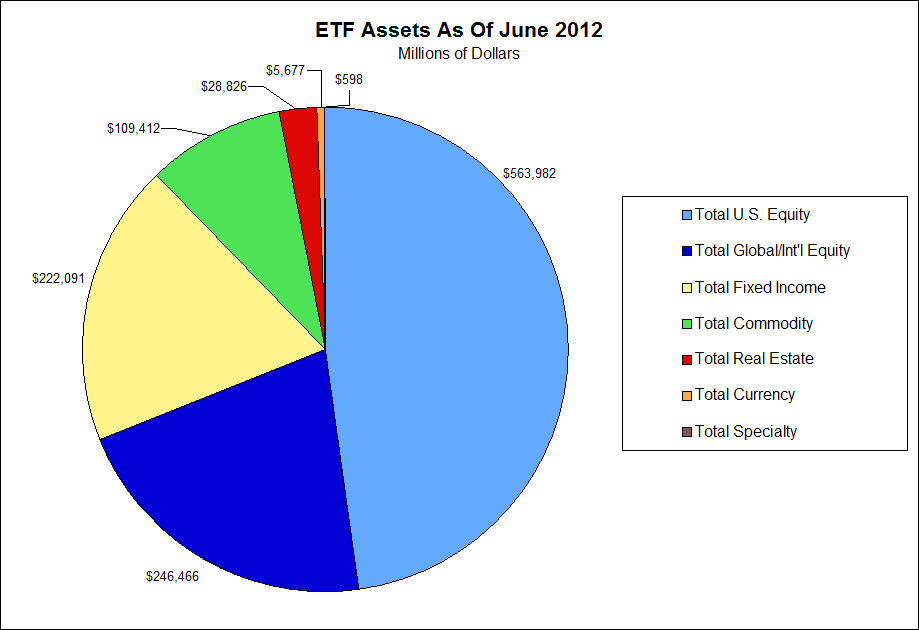
Thanks to data from the ETF Industry Association, we were able to compile the following pie charts to help answer these questions. The first two charts highlight the flows into various ETFs in the year ending June 2012 while the third and fourth charts highlight the assets in these funds.
The first thing that jumps out from all these charts is that the equity ETF universe is much more straightforward than many may believe. While leveraged or short equity ETFs may offer more interesting possibilities to investors, over 97% of equity ETF assets are in simple, long-only U.S. or international funds. In other words, less than 3% of equity ETF assets reside in short or leveraged funds.
When looking across all asset classes, equity ETFs account for roughly 69% of all assets while fixed income funds account for roughly 19% of all ETF assets. Perhaps a bit surprising is that assets in real estate ETFs are actually five times larger than assets in currency ETFs.
These charts should help shed some light on the growing ETF industry. However, keep in mind the assets and flows into ETFs are still relatively small when compared the mutual fund universe.
Source: Bianco Research
~~~
For more information on this institutional research, please contact:
Max Konzelman
max.konzelman@arborresearch.com
800-606-1872


What's been said:
Discussions found on the web: