When Career Risk Reigns
John Mauldin
October 4, 2012

We have entered an era of increasing correlation among what were once considered diversified investment classes. That would not be so bad, but overall returns have been reduced as well, almost across the board. As the song says, “Nowhere to run and nowhere to hide.” (For the younger generation, listen to the far superior version on YouTube, which was the original by Martha Reeves and the Vandellas, and not the noise of Korn or Caliban.)
This week’s Outside the Box takes us on a tour of recent research, which shows that correlations among a wide variety of asset classes are increasing. It comes as no surprise to serious investors that it is getting ever more difficult to construct a diversified portfolio. My friend and partner Niels Jensen of Absolute Return Partners in London looks at half a dozen different research papers of recent vintage to give us some insights into today’s investment climate and offer a few modest suggestions. All in all, a very useful piece of work. You can see more of their writing and research at www.arpllp.com.
This is the first Outside the Box under the new schedule, which will now bring you OTB on a Friday, for your weekend reading. I will now be writing Thoughts from the Frontline on Sunday afternoons and evenings, with the goal of putting it in your inbox on Monday morning.
Tonight is my birthday (63), and some of the kids are waiting for Dad to finish up and come down and be with them, so I will hit the send button. But I will note that I did 189 push-ups today (sets of 50, 50, 50, and 39 with other upper-body exercises) at the gym. That is twice as many as I have ever done. There is a story behind that, as technology “assisted” me. I still had to do the actual work, but a prototype of a new invention (no, not available yet) allowed me to recover from my exertion much, much faster and therefore do more actual pushing and pumping in the same amount of time. Nothing magic. No cool new biotech pill that makes me 10 times stronger. And no mechanical assists. I will write more at a later time as I test my new toy, but the first day was cool. Let’s see how it works in a few months. But a great way to start another year.
“Do not go gentle into that good night.”
My mother is 95, and I visited her in ICU yesterday. She offers a contrast to my own efforts to stay active: “Sixty-three sounds young to me now.” Her mind is as sharp as ever, but her body is just failing one part at a time. Getting old is not for sissies.
Your thinking I will enjoy 63 as much as possible analyst,
John Mauldin, Editor
Outside the Box
subscribers@mauldineconomics.com
The Absolute Return Letter October 2012
When Career Risk Reigns
I concluded last month’s Absolute Return Letter by suggesting that only when policy makers begin to address the underlying root causes that lie underneath the current crisis will we be able to leave the problems of the past few years behind us.
What I didn’t say, but probably should have said, was that an almost universal lack of appetite amongst policy makers on both sides of the Atlantic to deal with those root causes will ensure that the crisis will rumble on for quite some time to come. To paraphrase John Mauldin, politicians are like teenagers. They opt for the difficult choice only when all other options have been explored.
So far, only Greece has reached that point. The Spanish are probably next in line. And there will be many more countries forced to make tough decisions before this crisis is well and truly over.
This has repercussions for asset allocation and portfolio construction. The credit crisis, now into its sixth year (counting from the collapse of the Bear Stearns structured credit funds in June-July 2007), has changed the investment landscape on two important fronts. Investors have had to get accustomed to low return expectations – not something that comes naturally to Homo sapiens – and they have had to adapt to what is often referred to as the high correlation environment.
Let’s begin with a quick recap of what the credit crisis has done to Modern Portfolio Theory (MPT). If you google “MPT”, Wikipedia will tell you that it is “a mathematical formulation of the concept of diversification in investing, with the aim of selecting a collection of investment assets that has collectively lower risk than any individual asset.”
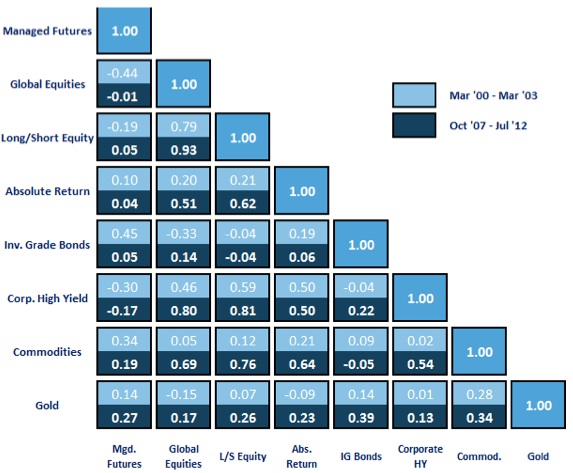
That’s all very well, provided asset classes behave the way Harry Markowitz assumed they would, when he produced his first paper on MPT back in 1952. The reality, however, has been very different in the post crisis environment. I have run a simple correlation analysis to illustrate the problem (see chart 1).
The 2000-03 bear market was massive. It followed an 18 year bull market which gave us valuations this world has never seen before. When the bubble finally burst, stock prices around the world fell like a stone. MPT followers still did relatively well, though, as other asset classes offered investors at least partial protection.
In chart 1 below I have compared correlations during the 2000-03 period (bright blue) with correlations in the current environment (dark blue). As you can see, with one or two exceptions, correlations are generally much higher now.
Now, you could quite reasonably confine this observation to the ‘academically interesting but why should I care?’ category, if it wasn’t for the fact that most investors around the world continue to manage money in a way that is deeply rooted in the MPT school of thought even when facts suggest that a different approach to asset allocation and portfolio construction is warranted.
Chart 1: Correlations between Asset Classes (2007-12 vs. 2000-03)
Source: MPI Stylus, Absolute Return Partners LLP
Nowadays, only a handful of sovereign bonds are considered safe haven assets. Pretty much all other asset classes are now deemed risk assets and they move more or less in tandem. Even gold looks and smells like a risk asset these days.
Take another look at chart 1. In the 2000-03 bear market commodities were an excellent diversifier against equity market risk with the two asset classes being virtually uncorrelated (+0.05). Nowadays, the two are highly correlated (+0.69). It follows that we are not only in a low return environment at present, as evidenced by the paltry return on equities since the end of the secular bull market in early 2000, but we can’t rely on the ability to diversify risk either.
Now, perhaps I should define risk. In traditional investment management parlour, risk is usually synonymous with volatility risk. One could make the argument that volatility risk is a risk that most investors could and should ignore (provided no leverage is used) and that only one element of risk really matters – that of the permanent loss of capital.
Whilst theoretically correct, the reason you cannot ignore volatility risk is that it profoundly influences investor behaviour. Few investors have the nerve to stay put when a financial storm gathers momentum.
Part of the problem is that investors generally have unrealistic expectations. Andrea Frazzini, David Kabiller and Lasse Pedersen published an interesting paper a while ago called Buffett’s Alpha (you can find it here) which is packed with interesting observations. I quote from their conclusion:
“Buffett’s performance is outstanding as the best among all stocks and mutual funds that have existed for at least 30 years. Nevertheless, his Sharpe ratio of 0.76 might be lower than many investors imagine. While optimistic asset managers often claim to be able to achieve Sharpe ratios above 1 or 2, long-term investors might do well by setting a realistic performance goal and bracing themselves for the tough periods that even Buffett has experienced.”
For those of you not familiar with the concept of Sharpe ratios, it measures the excess return (over and above the risk free rate of return) for every unit of volatility. The U.S stock market’s Sharpe ratio is about 0.39. In other words, Buffett has delivered a Sharpe ratio nearly twice the market average. Few would disagree that Warren Buffett is the stand-out investor of our generation. If the supreme talent can ‘only’ deliver a Sharpe ratio of 0.76, what is it that make professional money managers step forward again and again and promise their investors the prospect of Sharpe ratios of 1 or higher?
We are not supposed to make promises in our industry, yet I have had numerous ‘run-ins’ with professional portfolio managers over the years claiming they could deliver a sustainable Sharpe ratio in excess of 1. Going forward, I will make a habit of asking them what they think the Sharpe ratio of Warren Buffett has been over the past 30 years. They will almost certainly overestimate the actual number.
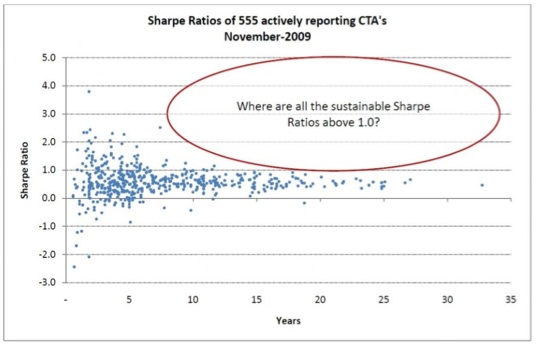
The proof is in the pudding, as they say, and I am afraid that in this particular case, the pudding is well past its sell by date. The most recent study I have been able to find on Sharpe ratios was conducted by Blackstar Funds back in 2009 on 555 actively reporting commodity traders – also known as CTAs or managed futures managers (chart 2). Commodity traders are interesting to study because they have the longest track record of any alternative investment strategy, allowing us to distinguish between luck and skill.
Chart 2: Sharpe Ratios of Commodity Traders
Source: Mebane Faber, Blackstar Funds
Chart 2 offers a solid piece of humble pie for a notoriously over- optimistic fraternity of money managers. When the reporting period is limited to 5 years or less, plenty of managers can claim to have a Sharpe ratio in excess of 1 (even a broken clock is right twice a day). Only a few manage to keep it above 1 for longer than 5 years, and after 10 years there are virtually none left. The lesson? Luck plays no small part in the short to medium term but reality gradually catches up with the lucky ones. Buffett is still the best!
Responding to low growth expectations in the U.S. and Europe, investors have been allocating increasing amounts of capital in recent years to emerging markets, expecting that the higher growth in those countries will lead to superior returns. There is only one problem with this strategy; there is no evidence whatsoever to support the thesis that high GDP growth leads to superior stock market performance.
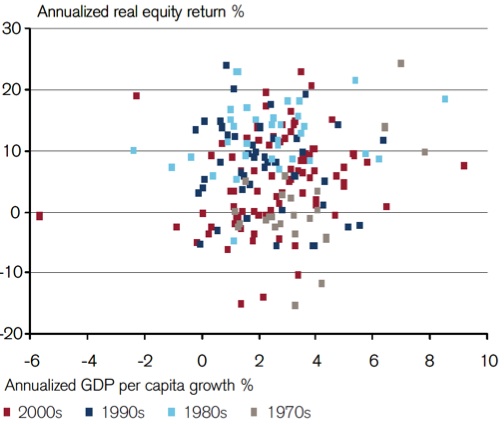
Elroy Dimson, Paul Marsh and Mike Staunton of London Business School did a study back in early 2010, covering 83 countries over four decades3, with the results being published in the 2010 version of the Credit Suisse Global Investment Returns Yearbook. They found little or no support for the idea that economic growth drives stock market performance (chart 3). (Not all countries in the study had total return data available for the entire 1970-2009 period, hence the different number of countries analysed in each of the four decades.)
More specifically, during the decade of the 1970s (the grey dots in chart 3) the correlation across 23 countries was 0.61. In the 1980s (light blue) there was a correlation across 33 countries of 0.33. In the 1990s (dark blue), the correlation across 44 countries was actually negative (–0.14) and finally, in the 2000s (red), the correlation across 83 countries was 0.22.
When pooling all observations in chart 3, the correlation between GDP growth and stock market performance comes out at 0.12. The R-squared is about 1%, suggesting that 99% of the variability in equity returns is associated with factors other than changes in GDP. You can find the entire study here.
Chart 3: Global Equity Returns vs. GDP Growth, 1970-2009
Source: Credit Suisse Global Investment Returns Yearbook 2010
So, with economic prospects in Europe and the U.S. likely to remain subdued, with risk assets remaining highly correlated and with emerging markets not necessarily offering a way out for investors, what can you do to generate a respectable return on your capital whilst appropriately diversifying risk?
I have been an observer of financial markets, and of those who operate within the markets, for almost 30 years. I have never before experienced investors paying more attention to career risk than they do at present. A preoccupation with career risk changes behavioural patterns. Decisions become more defensive, and sometimes less rational. (Before I offend too many of our readers, perhaps I should point out that what may be a dim-witted decision from an investment point of view is not necessarily irrational from a career perspective.)
According to the latest data from Hedge Fund Research, there were $70 billion of net inflows in to the hedge fund industry in 2011. $50 billion of those went to funds with more than $5 billion under management. This is a staggering statistic considering there is a wealth of research documenting that smaller managers consistently outperform their larger peers. I suppose nobody was ever fired for investing in IBM (sigh).
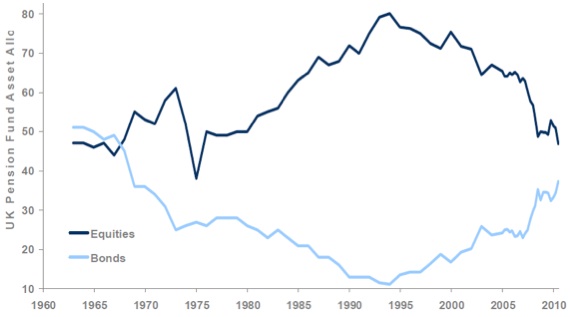
The misallocation of capital can also be driven by factors beyond the control of the individual. The UK pension industry is a case in point. With 84% of UK defined benefit schemes now under water, and with liabilities exceeding assets by over £300 billion (source: Morgan Stanley), the UK pensions regulator, the plan sponsors and the pension consultants all apply considerable pressure on the pension trustees who are often lay people not equipped to deal with complex situations such as a credit crisis. One result is an exodus from riskier equity investments into supposedly lower risk bonds (chart 4). We shall see who has the last laugh.
Chart 4: UK Pension Funds’ Allocation to Equities and Bonds
Source: “Who has the biggest pension risk in Europe?”, Morgan Stanley, August 2012
At a time where UK P/E multiples are near 30-year lows, and UK gilts are trading at record low yields, capital flows should, if investors behave rationally, move in precisely the opposite direction – away from bonds into equities.
The illiquidity premium is the excess return investors demand for holding an illiquid investment over a liquid investment of the same kind. The illiquidity premium can move within a very wide range and is usually highest during times of distress. The credit crisis has resulted in a dramatic fall in the appetite for illiquid investments which has caused the illiquidity premium to increase substantially more recently.
At the same time as the appetite for illiquid investments has been falling, opportunities have been on the rise. Banks all over Europe have been reducing their loan books with small and medium sized companies suffering the most as a result.
This has given rise to a new industry where pension funds and other long term investors provide capital to facilitate lending outside the traditional banking system. Given what is around the corner for the banks in terms of new and tighter capital requirements, this industry will grow to be much larger over the next decade.
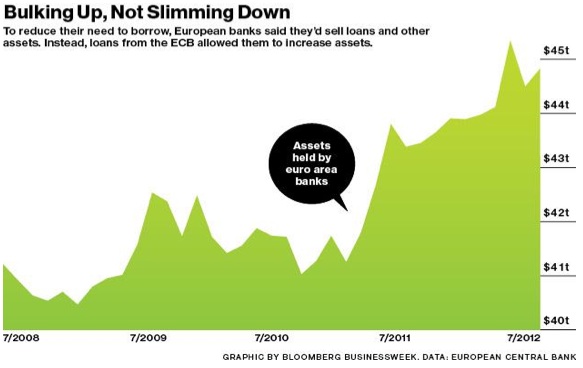
However, new data from the ECB suggest that European banks’ balance sheets are actually larger than ever (chart 5) so, on the whole, banks have merely shifted the balance sheet composition away from lending towards speculative investments funded cheaply through the ECB.
In other words, the European banking industry has become one massive hedge fund taking a punt on the ability of European sovereigns to service their debt. All of this will have to be unwound at some stage, suggesting that the deleveraging process in Europe’s banking sector is far from over.
Assuming that European banks eventually must bring the leverage down to U.S. levels or thereabouts, total assets in the European banking industry must be reduced from around $45 trillion today to less than half that number. Not only will that be painful but it could also cause the illiquidity premium to rise further.
The savvy investor will seek to take advantage of these inefficiencies and allocate his capital where others don’t go. In the long run, that is likely to be a winning strategy.
Chart 5: Assets Held by European Banks
Source: Bloomberg
Our friends at Altegris published an interesting white paper back in July on what they aptly have named Convergent vs. Divergent Investment Strategies (you can find the paper on http://www.altegris.com or here). Convergent strategies are the usual suspects – traditional long-only strategies as well as a number of alternative strategies that are all highly correlated.
Divergent strategies, on the other hand (and I quote) “… aim to profit when fundamental valuations are ignored by the market. These strategies – of which managed futures are the prime example – seek to identify and exploit price dislocations, often exemplified by serial price movement that reflects changing market themes and investor sentiment.”
The paper concludes – and I wholeheartedly agree – that investors need to inject divergent investment strategies, such as commodity traders, into their portfolios if they wish to protect themselves against large draw-downs during market distress. (Please note that commodity traders (managed future funds) follow a fundamentally different strategy from the commodity long-only strategy referred to in chart 1.)
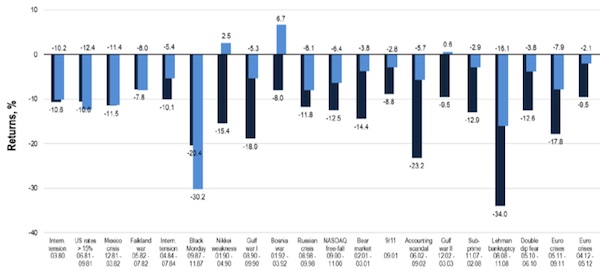
Alexander Ineichen at Ineichen Research and Management reached a similar conclusion when he published a paper earlier this year called Diversification? What diversification? Looking at 20 so-called financial accidents since 1980, Ineichen found that, of all the alternative investment strategies that he looked into, managed futures did by far the best job in terms of protecting portfolios in difficult times (chart 6a). Interestingly, managed futures have also done better than gold on that account. Having exposure to a diversified portfolio of hedge funds may have reduced the volatility somewhat, but losses during the drawdown periods were still significant (chart 6b).
Chart 6a: Managed Futures Funds in Difficult Market Environments, 1980-2012
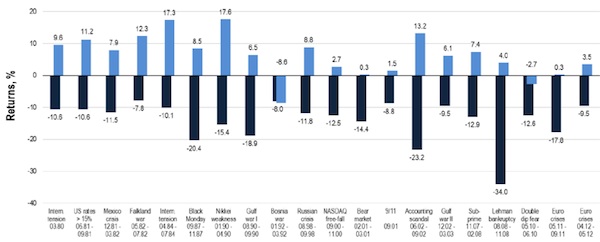
Chart 6b: Hedge Funds in Difficult Market Environments, 1980-2012
Source: “Diversification? What diversification?”, Ineichen Research and Management, June 2012
According to a recent study by the (friendly) geeks at SocGen Cross Asset Research, the average holding period for U.S. stocks is down to about 22 seconds (sic). Even if we cleanse the numbers for high frequency and other computer generated trades, there is no question that the average holding period for stocks continues to shorten. It is part and parcel of the risk-on / risk-off mentality which prevails at the moment.
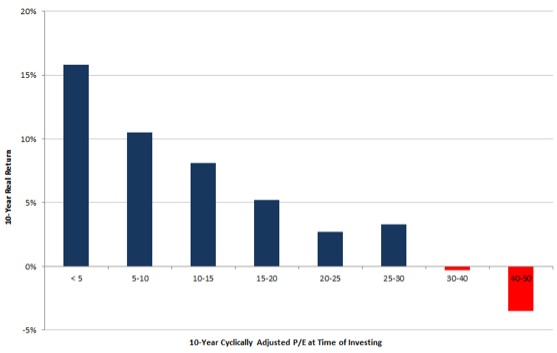
However, all research into the art of equity investing suggests that the best results are obtained through long term investing. It is in fact not complicated at all. Invest when the market trades below 10 times earnings. Sit on the portfolio for 10 years and, voila, you are well positioned to earn double digit annual returns (chart 7). Well, that is if history offers any guidance to future returns, which it doesn’t according to my legal counsel. We shall see.
Chart 7: 10-Year Real Returns (CAGR), U.S. Stocks, 1881-2011
Sources: Mebane Faber, Robert Shiller
The first problem with such an investment strategy for a professional investor is that it may not work for the first 2, 3 or even 5 years and, by the time it does, his career in the industry may be well and truly over. It is that career risk rearing its ugly head again.
The second problem relates to the confusion between P/E ratios at the aggregate market level and P/E ratios on individual stocks. The research we have conducted into this suggests that buying the lowest P/E stocks is not necessarily a winning strategy whereas buying the overall market when it is cheap very much is (long term).
The implication of chart 7 is that if you can identify the stock markets that trade at rock bottom P/E ratios relative to their historical range, you are probably on to the long term winners. The study behind chart 7 was conducted exclusively on U.S. stocks, but similar studies elsewhere suggest that it is a global phenomenon.
Now, with that in mind, which markets are currently cheap and which ones are not? Not surprisingly, the markets everyone loves to hate are the cheapest relative to their historical P/E range (Greece, Italy, Austria, Japan and Portugal in that order), whereas the ones everyone has fallen in love with are the most expensive (Thailand, Malaysia, Indonesia, Chile and South Africa in that order). However, I note with some comfort that no stock market in the world appears to be ridiculously overpriced at present on this measure.
Taking the equity discussion one step further, one of the longest standing debates amongst equity portfolio managers is whether to populate your portfolio with value or growth stocks. However, recent research seems to suggest that there is a third way which is far superior to the other two investment styles.
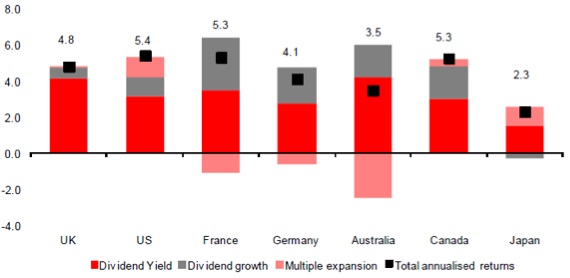
Our friends at SocGen have recently published the result of some extensive work they have conducted on the subject which suggests that investors should focus neither on growth nor on value but on quality instead. Quality is obviously a subjective term but so is value or, for that matter, growth. The approach taken by SocGen emphasizes the quality of the balance sheet and, in particular, the company’s ability to sustain its dividend policy. After all, dividends have been the main source of equity returns over time (chart 8). We just happily forgot about that during the happy bull days of 1982-2000.
Chart 8: Decomposition of Real Equity Returns since 1970
Source: SocGen Cross Asset Research
There is actually one approach to asset allocation I have not yet mentioned. In an environment such as this, where the mood swings can be sudden and quite violent, one can build a strong case for a much more dynamic approach to asset allocation.
Internally we operate with two layers of asset allocation – one for the long term (strategic asset allocation) and one for the short term (tactical asset allocation). The regular changes in sentiment do not affect our strategic asset allocation decisions but they certainly influence our tactical decisions. We use a mix of sentiment indicators and technical indicators to drive these decisions.
That’s pretty much it for this month. These are tricky times, and one must adapt; however, with a more creative approach it is indeed possible to structure portfolios that are not only likely to generate a respectable return, but they can also be designed in a way that enhances the downside protection materially.
Niels C. Jensen 4 October 2012


What's been said:
Discussions found on the web: