@TBPInvictus here:
On April 17, 2012, North Carolina Congresswoman Virginia Foxx stood before her colleagues in the House of Representatives and said (emphasis mine):
Ms. FOXX. Mr. Speaker, the March employment report continues to show us that the Federal Government has not been helping to create jobs in our economy. A Wall Street Journal editorial from April 9 highlighted a few examples from the report. Here is one extremely startling statistic:
The labor force participation rate–or the share of civilian population that is working–dropped again to 63.8 percent. In March, 2009, a month after the $800 billion stimulus passed Congress, the labor participation rate was nearly 2 percentage points higher, at 65.6 percent.
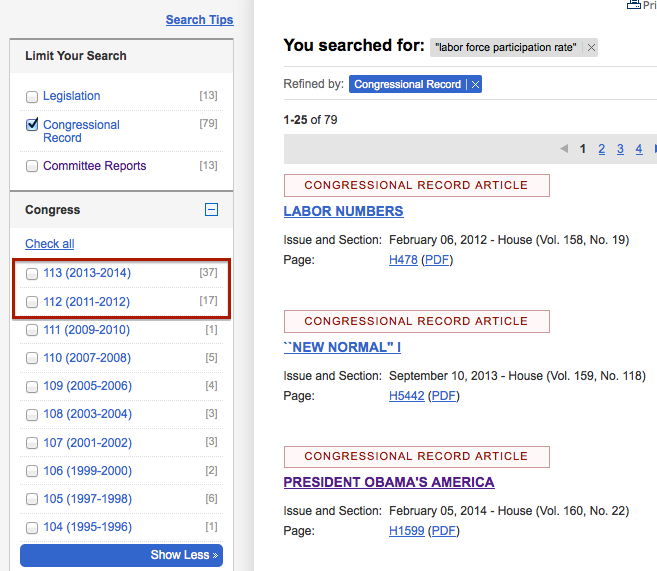
Interestingly, the Congressional Record has seen a hefty spike in mentions of the labor force participation rate over the past few years, and I can assure you they’re almost exclusively by Republicans and unflattering toward “President Obama’s America.”
And there’s this:
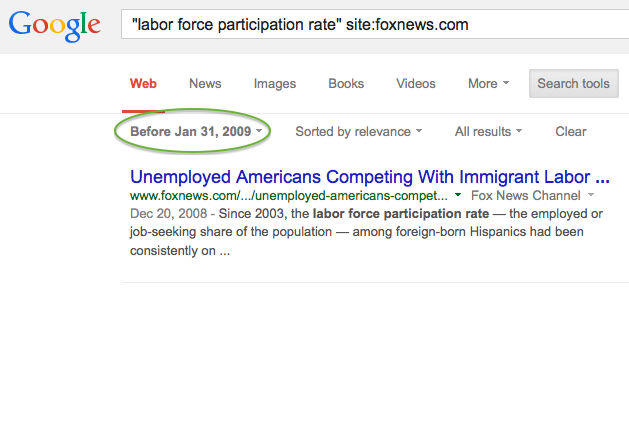
Here’s a search of “labor force participation rate” at foxnews.com (as of around 7:45 PM ET on May 8):
It’s good to know that Fox has been all over this important issue. The LFPR has been on the decline since about 2000, and I’m sure they’ve covered it very closely since it peaked. Let’s check their coverage during the Bush administration:
Hmmm. Only one story until President Blackenstein took office. Very curious.
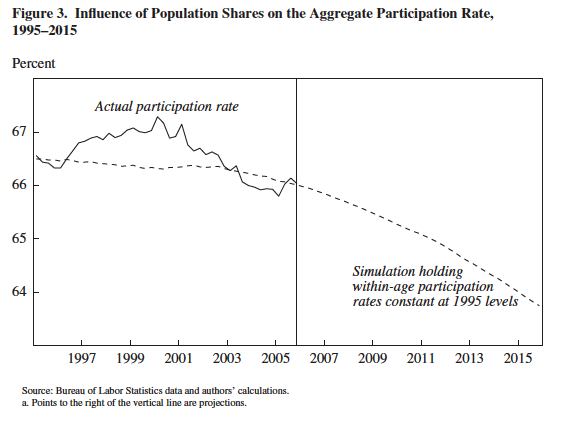
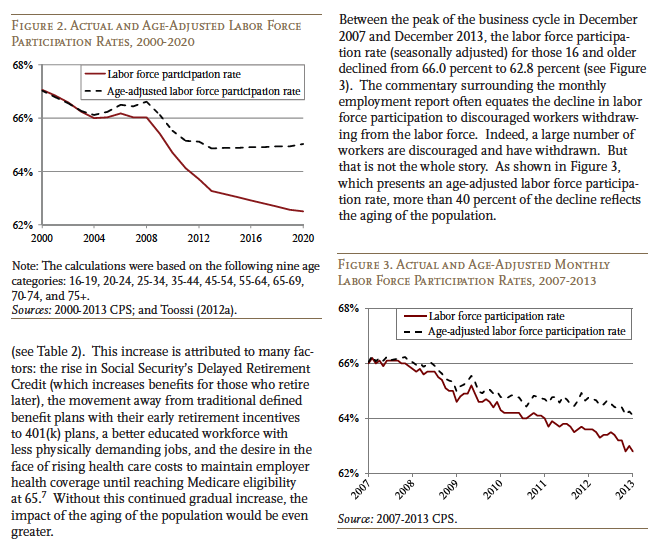
More curious still is why any of this is so “extremely startling” to anyone. I have found research back to 2002 – and I’m sure I could find even earlier – that foretold of a decline in our LFPR due to our demographics which, unlike variables such as policy making, are carved in stone. Yes, to be sure, the decline was exacerbated by the severity of the recession, but this story was essentially written between 1946 and 1964 when the Boomers made their collective entrance.
For example, here is a chart from a 2006 piece The Recent Decline in the Labor Force Participation Rate and Its Implications for Potential Labor Supply:
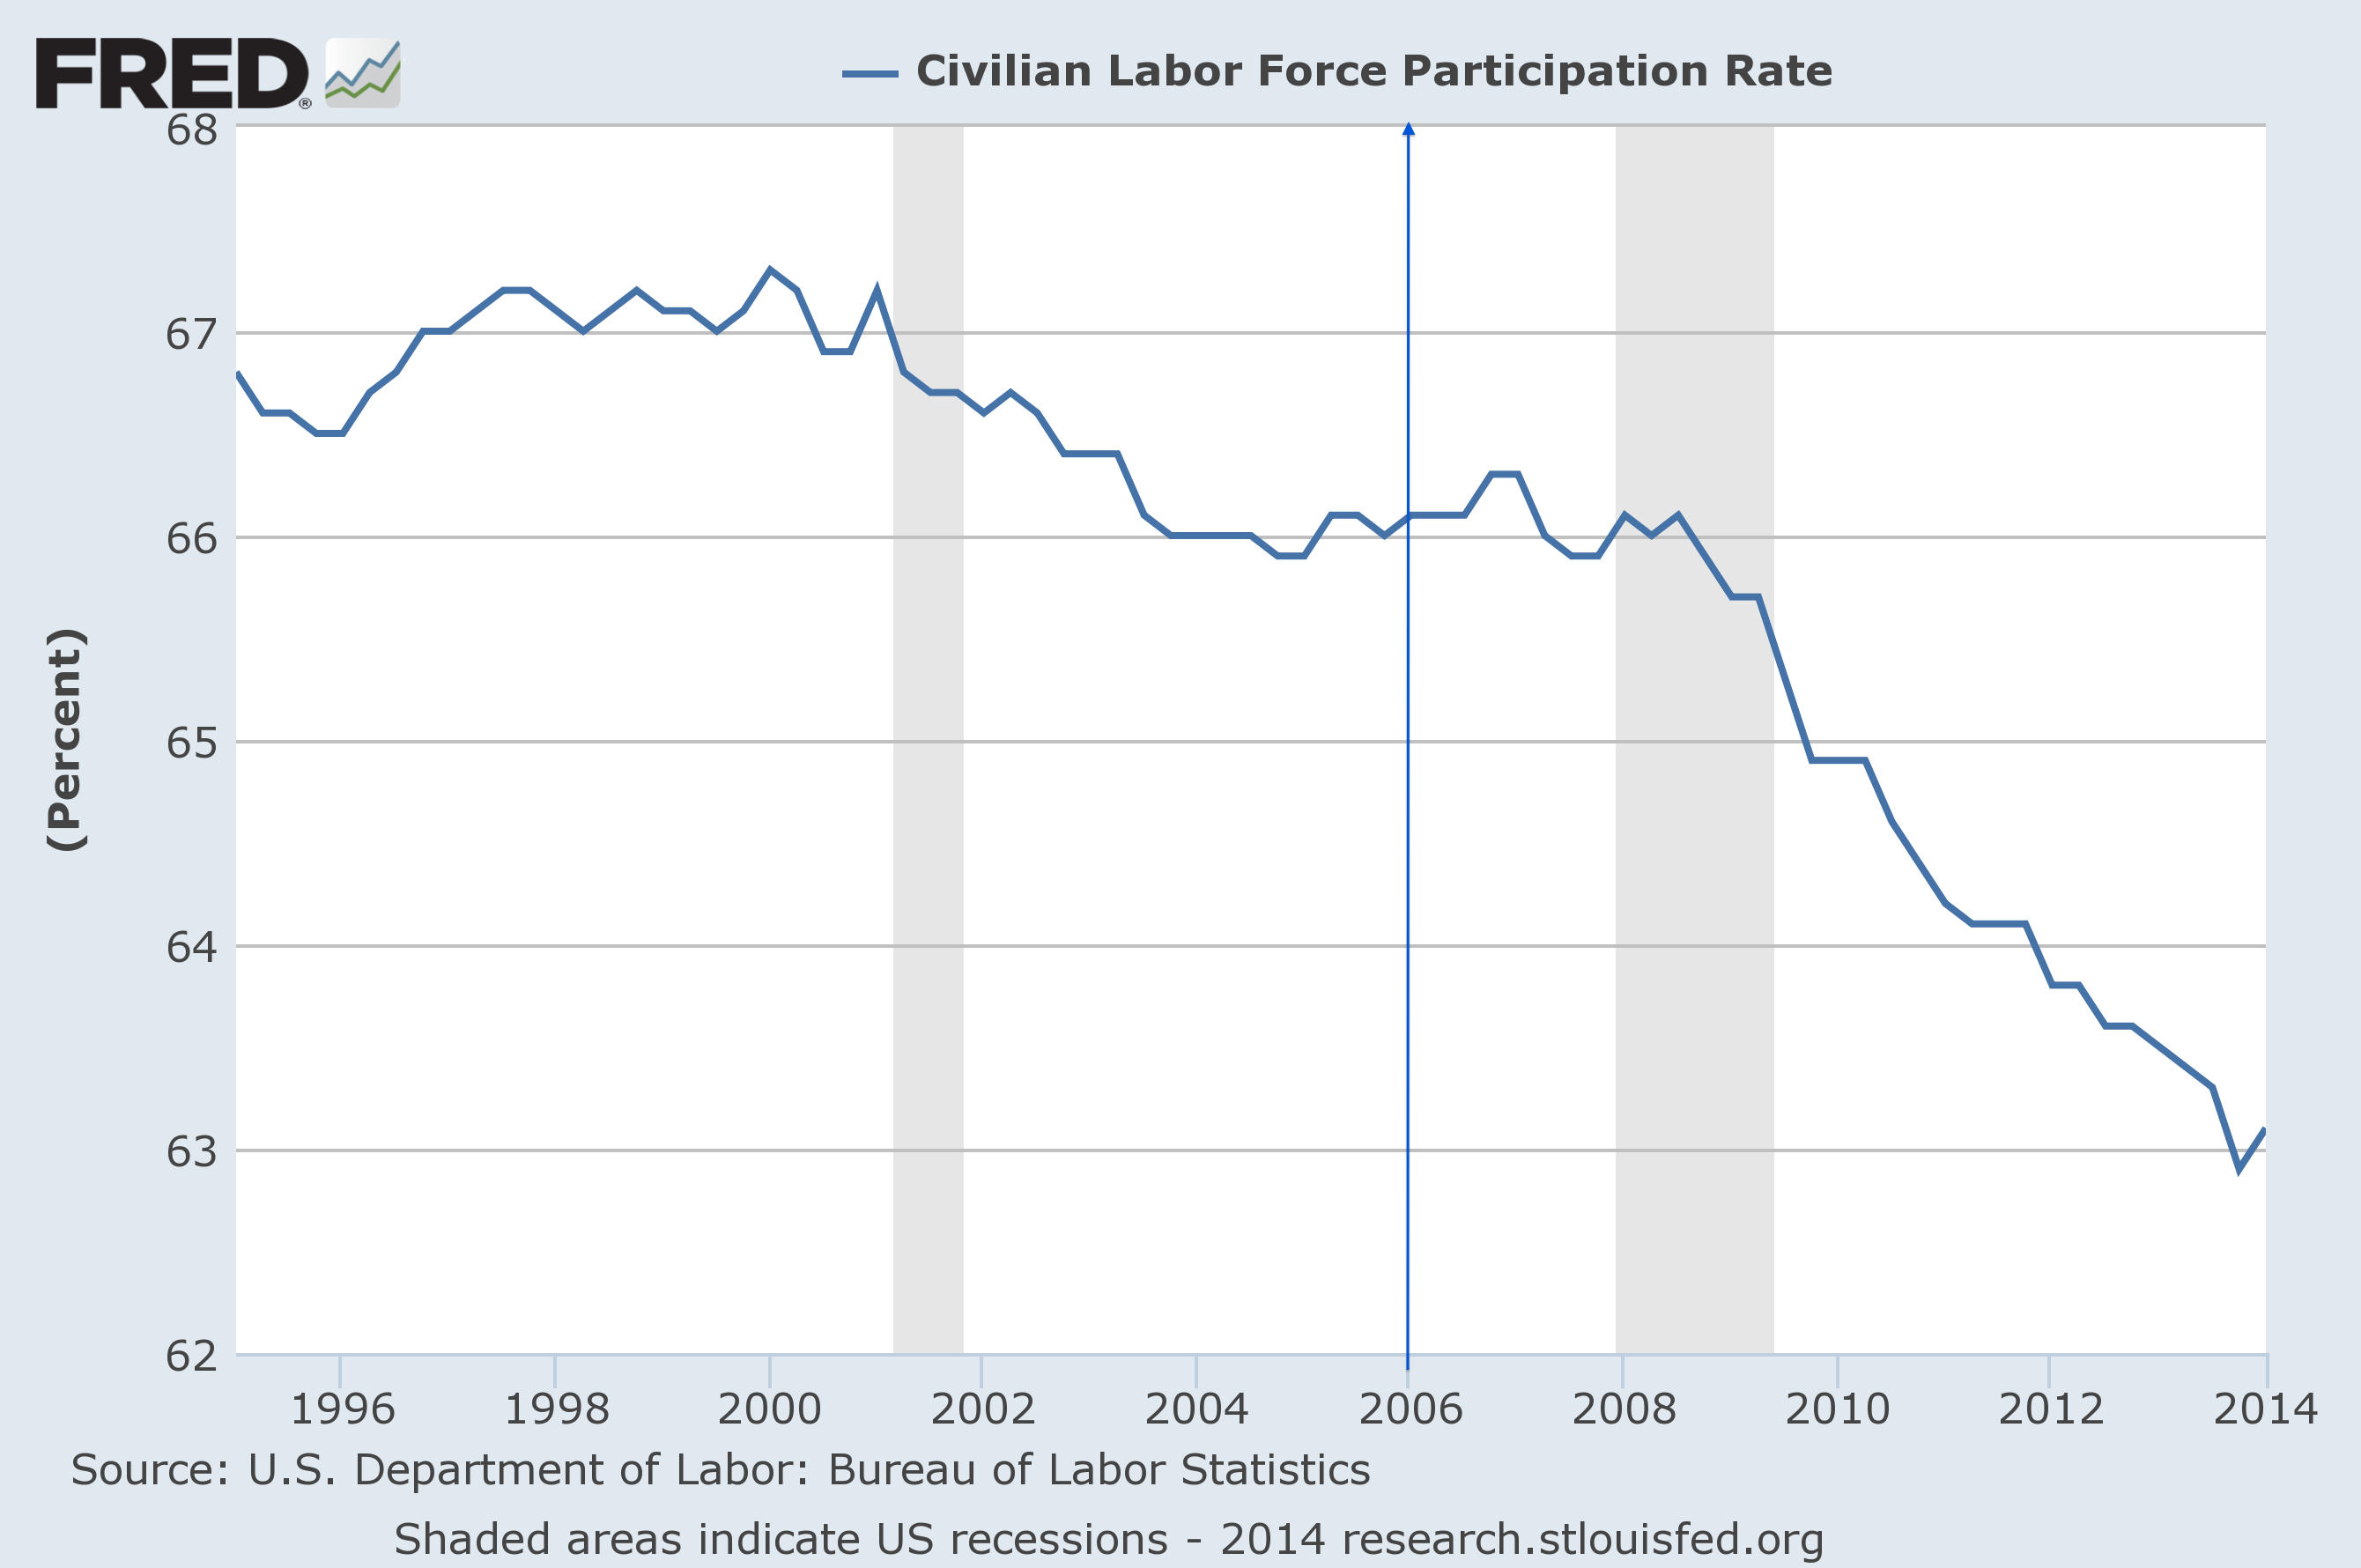
So, eight years after that paper was written, how have things played out? Let’s have a look:
[Source: St. Louis Fed. Series: CIVPART rendered quarterly to match preceding graph.]
There’s also this, from the Center for Retirement Research at Boston College, from February of this year, which tells much the same story:
St. Louis Fed President James Bullard gave an excellent speech on the LFPR in February:
I have reviewed some of the available literature on this topic. My view of the literature is that carefully constructed empirical models of the hump-shaped trend in the U.S. labor force participation rate do a good job of explaining the data. These models suggest that the current participation rate is not far from the predicted trend. This means, in turn, that the cyclical component in labor force participation is likely to be relatively small.
Translation: It’s mostly demographics with a touch of recession.
Said BLS in its December 2013 forecasts (emphasis mine):
Of note is the fact that the drop in the labor force participation rate was just 0.6 percentage point during the 2007–2009 economic downturn whereas, between 2009 and 2012, since the end of the recession, the rate declined by another 1.7 percentage points. A major factor responsible for this downward pressure on the overall labor force participation rate is the aging of the baby-boom generation.
Various regional Fed banks have weighed in on the LFPR, all striking a similar tone. Bill McBride over at Calculated Risk has written about LFPR many, many times, most recently here.
Little of what is happening with the LFPR is newsworthy. Yes, some of it is residual weakness from the recession, but our demographics are what our demographics are. Sadly, those who are focused on deceitfully misrepresenting what is going on with the LFPR will probably have ammunition for years to come. That will not change the fact that they’re being deliberately misleading.
Sincere thanks to those authors and researchers who took the time to discuss their work on the LFPR with me. Your time and insight were very valuable and much appreciated.
Further reading (and for the purpose of memorializing these links):
Age-Adjusted Labor Force Participation Rates 1960-2045
Employment outlook: 2012–22
Labor force projections to 2022: the labor force participation rate continues to fall
Visual Essay: Long-term labor force
Projections of the labor force to 2050: a visual essay
Employment outlook: 2010–20
Labor force projections to 2020: a more slowly growing workforce
Labor force participation:
A behavioral model for projecting the labor force participation rate
Employment outlook: 2008–18
Labor force projections to 2018: older workers staying more active
Employment outlook: 2006–16
Labor force projections to 2016: more workers in their golden years
Long-term labor force
A new look at long-term labor force projections to 2050
Employment outlook: 2004–14
Labor force projections to 2014: Retiring boomers
Employment outlook: 2002–12
Labor force projections to 2012: the graying of the U.S. workforce
Consumer Spending
Consumer spending: an engine for U.S. job growth
Long-term labor force
A century of change: the U.S. labor force, 1950–2050
Employment outlook: 2000–10
Labor force projections to 2010: steady growth and changing composition
In addition the following are some interesting articles from different researchers on the labor force participation rate.
–Kansas City Fed http://www.kc.frb.org/publicat/econrev/pdf/12q1VanZandweghe.pdf
–Richmond Fed http://www.richmondfed.org/publications/research/region_focus/2012/q2-3/pdf/cover_story.pdf
–Journal of Economic Perspectives http://www.class.uh.edu/faculty/cjuhn/Papers/docs/30033665.pdf
–St. Louis Fed http://www.stlouisfed.org/publications/re/articles/?id=2419



What's been said:
Discussions found on the web: