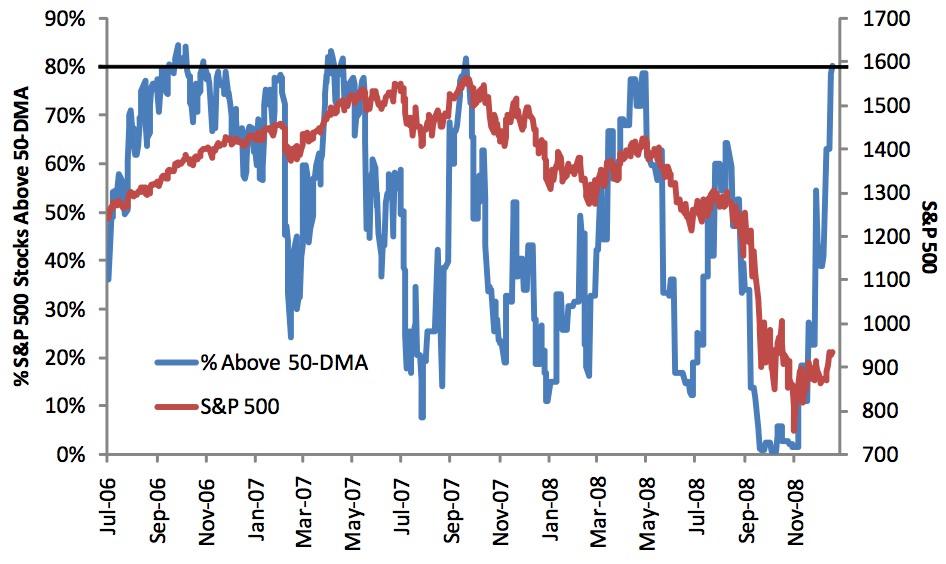
In the S&P 500, 80% of stocks in the index are trading above their 50-day moving averages, which
is the most overbought reading since October 2007.
While all the handwringing is over the ADP report, I would look to this chart as the more probab le cause of the sell off than anything . . .
>
Percentage of S&P 500 Stocks Above 50-Day Moving Averages
Chart courtesy of Bespoke Investment Group


