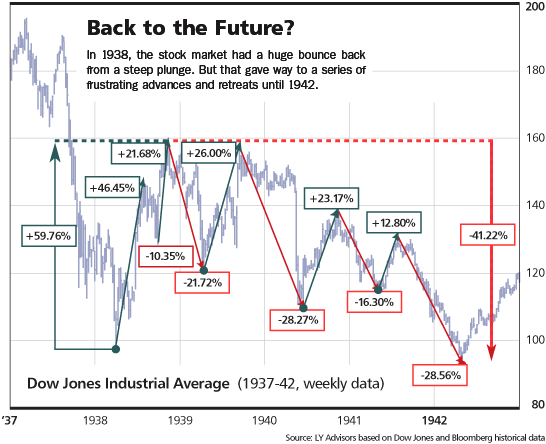
Fantastically interesting chart from technician Louis Yamada showing the details of 1938 rally and beyond.
Louise notes that “It is almost uncanny the degree to which 2002-08 has tracked 1932-38.” The structural bear market, according to her, is less like my favorite analogy, 1966-82, and more like 1929-42. (Doug Kass has also mentioned the 1938 parallel).
My own view is the current market environment is more similar from a psychological perspective to the 1966-1982 secular Bear market than 1938. I have 2008 = 1973 in terms of depth of sell off (but twice as fast). The rally in 1974 was almost 75%.
The psychology is a factor driving the pros and mom & pop alike. There still remains excess animla spirits that may need a good ringing out, a Death of Equities moment.
The parallels to the later days of Viet Nam (Iraq) are there, the run up and down in price of Oil, Nixon (Bush) as a terribly unpopular president — these are simply too similar to ignore.So too the massive profit destruction from highs just a few years prior.
On the other hand, the degree of despair, unemployment levels and homelessness is far far away from 1938, and much closer to 1973. Other difference: The impending entry in WWII, the massive social dislocation on Main Street, the lack of safety nets of any kind.
Regardless, it is a fascinating disucssion worth delving into further.
Here is Yamada’s chart:
>
Excerpt:
So the dot-com collapse parallels the Great Crash and its aftermath, followed by a rather nice recovery in 2003-07, similar to 1933-37. The parallels continue, with the collapse from late last year into this March tracing a similar, sickening trajectory to late 1937-38, as illustrated in Louise’s chart nearby. That drop led to a strong reaction rally, not unlike the current one, for a total gain of 60%. But that was broken into three segments: an initial rally of 46%, similar to the move from the March lows. Then we saw a 10% pullback, not unusual in a rally, then another gain of 22%.
From there comes the hard part. Starting in November 1938, there was a 22% drop, qualifying for the 20% rule-of-thumb definition of a bear market; then a rally of 26%, fitting the definition of a bull market, into the fateful month of September 1939, the start of World War II.
Then came a series of bull and bear trades — down 28%, up 23%, down 16%, up 13%, and the final decline into 1942 of 29%. After this nauseating roller-coaster ride, the market was down 41% from the 1938 highs (analogous to where we are now) to the 1942 lows.”
Interesting stuff . . .
>
Previously:
Market Rally: 1974 or 1982? (May 5th, 2009)
http://www.ritholtz.com/blog/2009/05/market-rally-1974-or-1982/
S&P500 Percentage Swings (April 3rd, 2009)
http://www.ritholtz.com/blog/2009/04/sp500-percentage-swings/
1966-1982 Trading Range (December 29th, 2005)
http://www.ritholtz.com/blog/2005/12/1966-1982-trading-range/
Source:
Do Be Wary of Green Shoots
RANDALL W. FORSYTH
Barron’s May 25, 2009
http://online.barrons.com/article/SB124303129632948467.html
~~~

 0
0
What's been said:
Discussions found on the web: