Today’s futures makes the latest missive from Andrew Horowitz of the Disciplined Investor all the more timely: How does all of the volatility these days compare historically to past market cycles?
Looking at daily and intraday moves over a long period, 2008 has had some of the biggest daily moves, only second to the 1930′s. On a point basis, it has been significant. But from a historical perspective, the recent action does not make a big showing in the Top 25 on a percentage basis.
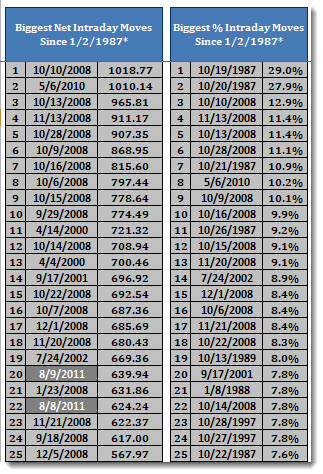
First is a look at the biggest net point gains and percent moves on an intraday basis:

*Intraday data starts 1/2/1987.
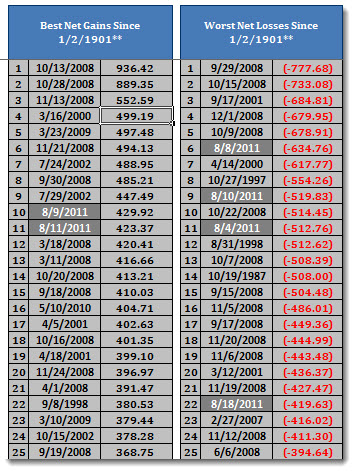
Next, the best and worst daily net point gains. Notice that there are several during 2011.
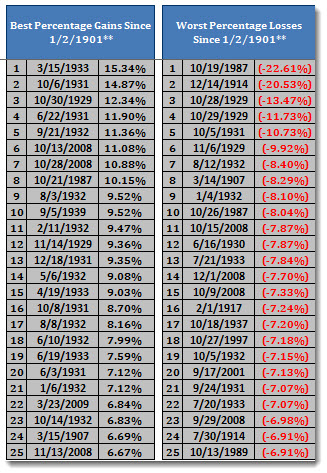
Finally, the best and worst days on a percentage basis. The 1930′s takes the award.

**Earliest available date for daily gains and losses after 1/1/1901 is 1/2/1901 or the next trading day.
Source: The Disciplined Investor


What's been said:
Discussions found on the web: