From Torsten Sløk of Deutsche Bank:
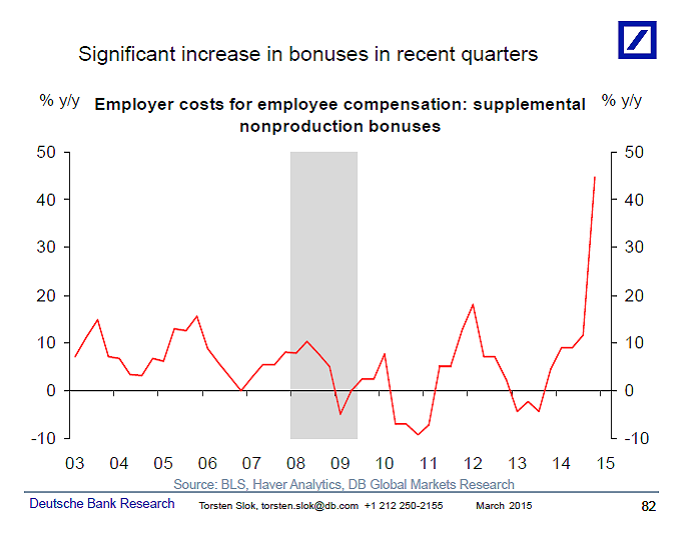
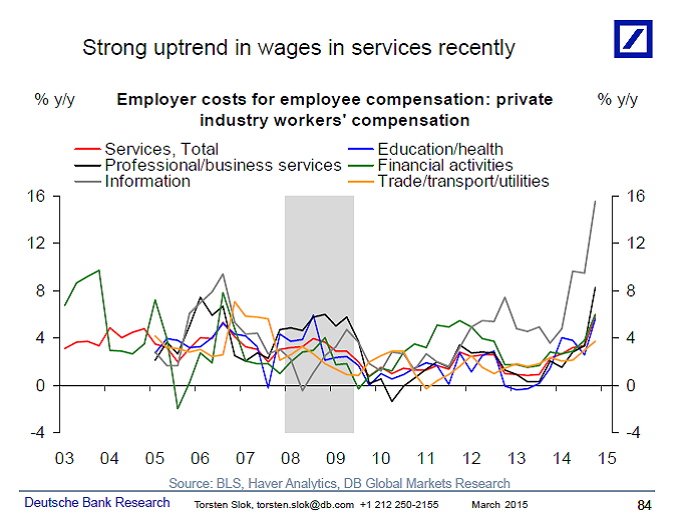
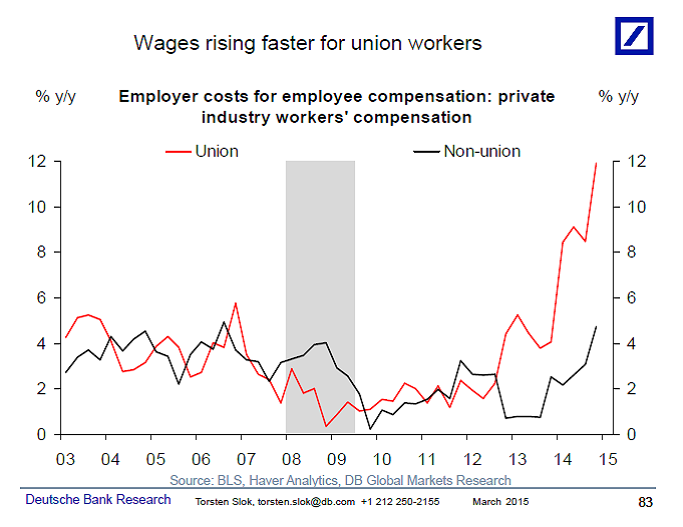
The first chart below shows that over the past year employer costs have risen significantly. The second chart shows that the rise is driven partly by a significant increase in bonuses. The third chart shows that the uptrend in wages can been seen across all parts of the services sector. And the fourth chart shows that wages are rising faster for unionized workers. This data, the Employer Costs for Employee Compensation (ECEC), is created using the same raw data that goes into the Employment Cost Index (ECI). The difference between the ECI and the ECEC is that the ECI controls for changes in the industrial-occupational composition of jobs. In other words, the ECI is intended to indicate how the average compensation paid by employers would have changed over time if the industrial-occupational composition of employment had not changed from the base period. The ECEC data on the other hand, does not control for the effect of a change in the composition of jobs. For example, if a company goes from hiring fewer customer services workers to hiring more R&D workers then it would show up in the ECEC data as higher wage inflation (because R&D workers generally have higher wages than customer services workers).
This happens to be consistent with the data showing that employment growth has been stronger for high-wage occupations and it is also consistent with the recent strong uptrend seen in private sector R&D spending (see also the charts I have sent out about this). In the 1990s we saw the opposite, with the ECI above the ECEC because more lower paying jobs were created. For more discussion of this and the differences between the ECI and the ECEC see also this BLS article here: http://www.bls.gov/opub/mlr/cwc/explaining-the-differential-growth-rates-of-the-eci-and-ecec.pdf. The bottom line remains that there are several ways of measuring wage inflation and although average hourly earnings remains flat, several of the other measures of wages are showing signs of broad-based wage pressure.


RE: Union wages….
Typically union wages are determine by negotiated contract and employers prefer multi year deals. In ’12, as the recovery became undeniable, union wages accelerated due to negotiated raises and yearly wage increases. That’s why the wage increases tracked the employer ability to pay them rather than the labor market tightness.
That costs are rising for the *employers* only matters to the rank and file to the extent they are participating at the other end, i.e. seeing their incomes rise. Charts 1 and 2 are not persuasive in that regard. Chart 3 is interesting. Chart 4 is misleading, as only 11 percent of workers are members of unions, which means that nothing much is going on for the other 89 percent. What that chart does do, however, is argue strongly for the importance of unions in our economy.
I couldn’t have said better myself.
Chart 3 also shows a clear outlier, the costs of “information” workers. I believe that’s mostly due to a relatively small number Silicon Valley & Silicon “alley” companies that in addition to salaries offer free buses to work and free massages. That is NOT representative of the industry as a whole.
90% or more of corporate IT staff will be laid off as more and more server rooms and data centers are being shut down as the workload moves to the “cloud.”
Torsten is an obedient little sock puppet desperately trying to please his masters by coming up with “data” in support of their favorite narrative.
Figure 1: Compensation growth is back to it’s miserably low pre-recession level.
Figure 2: Bonuses to the overlords are way up -lets pretend its “wages” to hide who is getting it.
Figure 3: The Rentier businesses are sucking people dry – lets call them “industry workers to hide…
Figure 4: Although the 90% of (non-union) workers are barely back to pre-recession levels lets take the opportunity to make them angry at the other 10% who are doing a little better.
If it looks like a tool and it analyzes like a tool, it must be a duck!
I find it difficult to believe that bonuses shot up so much (as shown in chart #2) — unless the baseline bonus amounts are very small numbers, in which case, a 45% YoY rise is likely to al;so be a Very Small Number.
In my career in the IT business, I worked for five different employers, and only received a single bonus from any of them. Bonuses were the equivalent of receiving a Purple Heart in the Good Olde Days, and (I believe) are awarded only posthumously in today’s world of zero benefits, part-time, 24-hour support, and multiple part-time jobs.
But as I said, if the amounts being referred to in the YoY percentage change charts are minuscule to begin with, then such charts might be valid … but worthless.
Percent Year-over-Year charts have some utility, but only in a very narrow range of circumstances. Most often, they are employed to deceive, as a casual glance at chart#1 might lead the uncritical reader to think that total compensation is now well above where it was in 2007. But if you eyeball the percentages shown, and do the cumulative arithmetic, one arrives at a gain in the employer cost for employee compensation between 2007 and 2015 being up by around 20% !!!
This strikes me as frankly incredible, as the world is rife with stories of wages being frozen for multiple years at a time, with the freezes broken by a paltry 3% bump, with benefits being slashed continuously the entire time. Of course, it could be that “employer costs for employee compensation” might include the costs for layoffs, which are costs born solely by the employer, with the employee receiving not much of an increase at all.
A couple of my millenial kids got bonuses recently in lieu of pay increases. Their employers have seen an uptick in staff turnover and are hoping some quick bonuses will slow that. However, management of their companies has worked tirelessly over the past couple of years to piss off their staff, so they will probably need more than a couple of thousand in bonuses to change the trend.
does chart 2b mean that one time bonuses are growing? and is this most employees. or just a few with out sized bonuses?
What a revelation! When the economy rises companies get busier and the demand for labor goes up and so does the cost. One might think that capitalism works if given enough time.
Un fortunately as Invictus points out not all employment costs go to employees. Good examples of this are the employers portion of payroll taxes and the increased cost of health care. In addition adding employees to comply with regulations and over paid executives are also in this cost.
As far as unions go one needs to look at the “Big Picture” and look at the cost and the benefit of these unions. For example unions are very prevalent in government organizations and just like over paid executives these organizations add overhead to the every day worker. It is the other non union organizations that pay taxes and consume the union organized service. Are students really better off because of the teachers unions? Another interesting union study is to look at the doc workers that slowed down the economy recently The average doc worker gets $147,000 in annual salary and pulls in $35,000 a year in employer-paid health care benefits, was this warranted?
What we need is sustainable economic growth. Unfortunately when growth picks up unions and executives are the first pigs to feed, then the rest of the economic benefit gets distributed. What happens these days is that when the demand for labor starts to increase we do not have enough qualified labor resources to grow the economy and there is not much in the way of corporate training budgets (Hello teachers unions and executives!) so hiring starts, then quality goes down, then of course the demand for the goods go down and the economy fizzles.
If I’m reading this correctly, it appears to be claiming that employment growth is strong at both extreme ends of the wage spectrum. Lots of low wage growth, lots of high wage growth, but very little in the middle.
Unfortunate if true.
Employer cost for management and top brass increasing has nothing to do with “wage-inflation” or “broad-based wage pressure”. It simply indicate that the takeaway of companies from stock holders by the top management has continued its pre-recession path. These top managers make use of the passive investors to lock down all oversight on behalf of the actual owners. Then they use this complete power to give themselves huge increases in bonuses and compensation. Look at GS, a friend of mine has owned that stock for about 8 years, how much do you think he has made?- how much did top management make?
Bonus? What is this Bonus you speak of…..?
But really, the increase in service wages is likely due to the state and municipal minimum wage legislation that has been passed over the last year of so. Most have a multi year escalation with a COLA adjustments afterwords. FWIW, Wallmart just announced that they will increase wages as have a couple of other big box overlor…. I mean employers…..
As to Bonuses, I wonder if this is includes stock grants or executed options….? If so all that cash that corporations didn’t invest (during the time of the lowest interest rates we will ever see) and put in to stock buy backs will have really paid off for the speculators and senior executives in the C suites….
Yeah, so, I’m with the other sanguine posters here, particularly Invictus.
“The bottom line remains that there are several ways of measuring wage inflation and although average hourly earnings remains flat … “. Really, BR? Does Torsten get a pass when it comes to cherry-picking data to suit an argument?
Last time I checked, for most people, a “wage” and “earnings” are synonymous.
By Cherry-picking 4 parameters that (barely) support a specific narrative, and ignoring dozens of other parameters that are better surrogates for the question of interest (i.e., wage inflation); Torsten reveals himself as being more interested in pushing the narrative than the true answer to the question.
I would not think of this post as BR giving Torsten a free pass. Knowing the commenters here you could make a better argument of this being BR throwing Torsten to the wolfs.
Non production bonuses are driving wages up? They are acting like wage earners employees bonuses are guaranteed by TARP legislation(they should never have been paid as anyone not receiving it had no place to go).
some actual numbers to scrutinize …
http://www.bls.gov/news.release/wkyeng.t01.htm
It’s obvious that wage inflation is taking hold. It explains the bidding wars that zillow will predicts will send housing soaring by … oh, wait, they are predicting a drop of 1%.