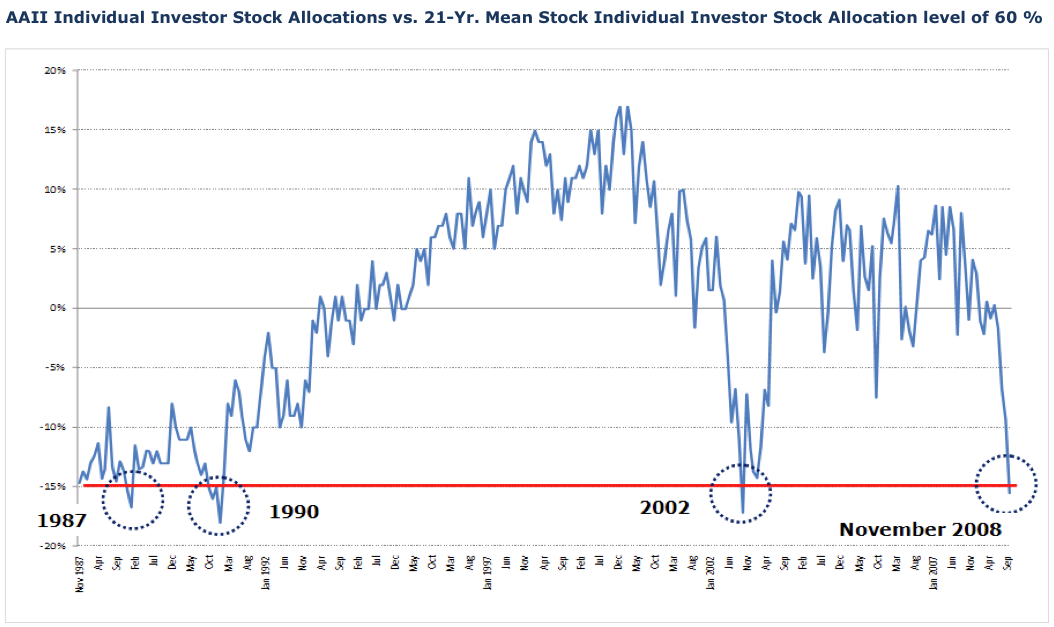
Here’s a terrific sentiment read: the amount of money individuals have exposed to equities relative to their historical average. The chart below shows equity allocations by individual investors above and below their normal 21 year mean allocation to stocks (the 21-year mean allocation to stocks is typically 60 %).
>
AAII Individual Investor Stock Allocations vs. 21-Yr. Mean
click for ginormous chart
Chart courtesy of FusionIQ
>
The present reading puts us 15 % under the 21-year historical mean. This reading is significant because it mirrors the readings seen at other major lows such as 1987, 1990 and 2002. Now while it doesn’t mean we bottom tomorrow (though we could) it does mean stocks are certainly in the 8th or 9th inning of the decline and not the 3rd or 4th (however as we know in baseball even the last few innings can get ugly sometimes before the game ends).
Liquidity plays a major role in the future direction of stocks because it gauges available — as well as future — buying power. When investor allocations to equities are very low this is bullish for stocks as it suggests investors (not cash) have moved to the sidelines in droves.
This does two things: Low equity allocations suggest investors have sold in droves, thus reducing much of the selling pressure from the market; Second, the low equity allocations suggests a large buildup in sideline cash (ie. new buying power) from many individuals.


What's been said:
Discussions found on the web: