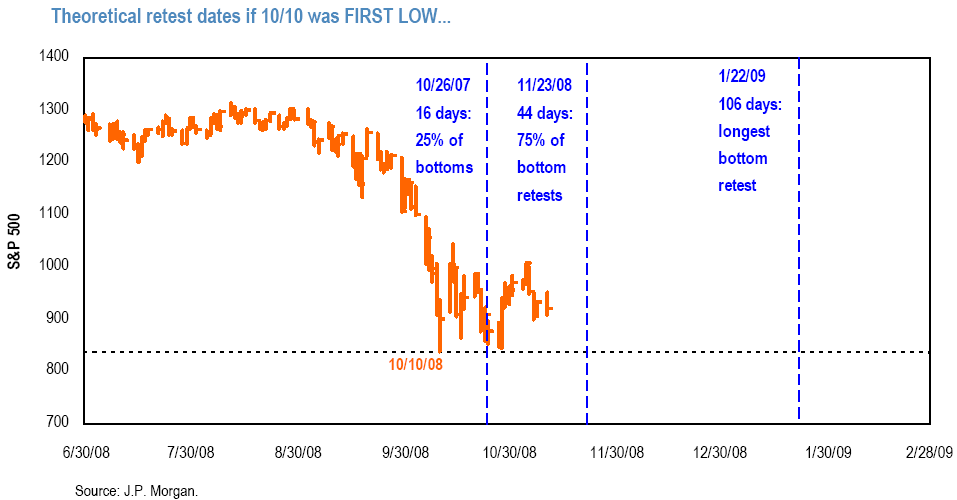
Markets have come increasingly close to their October 10th lows. Contrary to what you may have read or heard on TV, this is precisely as it should be. Why? Major lows get retested. That is a basic tenet of market behavior, and crowd psychology. (This has been verified by a variety of studies by different technicians, economists and traders).
There are a variety of different ways to define the terms, yielding some variations, but the basic outline remains the same: All major sell offs hit a point where markets become so deeply oversold, that a rally ensues. Depending upon how deep the prior sell off is, this rally typically lasts anywhere from 3 to 6 weeks. Our work at FusionIQ shows that these snap-backs typically go for about 4 weeks and average ~24%.
Others have come up with some variations of these findings: David Rosenberg of Merrill Lynch looked at the 12 biggest market bottoms of the past century; he found that 35 days is a good rule of thumb for the length of time for the rally; the subsequent retest lasts a similar length of time. Justin Mamis developed a variation on this theme of bottom, rally, retest, rally. Ned Davis Research has also written on the subject.
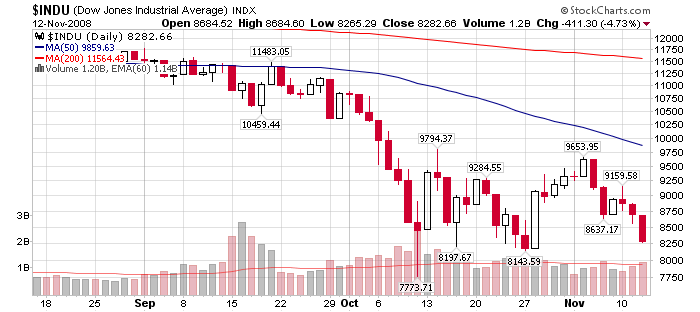
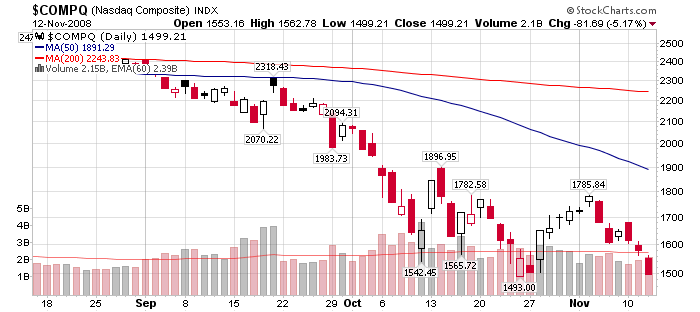
On a closing basis, the SPX is a 3 points above its October 27th low, but 48 points below its October 10th lows. Nasdaq is significantly below the October 10th lows and 5 points below the end of month lows. The Dow is also below the closing lows of October 10th, but above the October 27th close.
Under most circumstances, I prefer to use closing data. However, October 10th was such a significant panic sell off — the Dow freefell 1000 points before snapping back intra-day — that trading, rather than closing prices might be preferred.
On that basis, the Dow and the SPX are above their intraday October 10th lows; the Nasdaq traded slightly below its intraday 10/10 lows, but climbed back over those levels.
The past 30 days saw a move that gained about 18%. We have traded around our October 10th and October 24th buys (which made money) and other subsequent buys (which did not). While these trades certainly did not capture the full 18%, they have overall outperformed the SPX over the past month.
Hence, we are buyers as markets approach those levels again. The October 10th intraday lows remain our line in the sand as far as trading stops go.
JPM Retest Window
>


What's been said:
Discussions found on the web: