Richard W. Arms, Jr., is one of the world’s most respected Stock Market personalities. His technical work is used worldwide and he has been a guest speaker on four continents. His books have been translated into a number of other languages, and his methodology is familiar to most Stock Market traders and professionals in every financial center. He makes frequent appearances on financial television, nationally and internationally. He is one of only ten living recipients of the highest recognition in the technical analysis field – The annual Market Technicians’ Award. In 2008 he received the Traders Library Halll of Fame award.
~~~
On the chart below we are seeing a daily Equivolume chart of the Dow Industrials. It was the breaking of the descending trendline going back to September that prompted last weeks’s enthusiasm. In addition, the high of mid-December had been penetrated. On Monday of last week the follow through strength was enough to take the Dow to, but not through, the more important high of early December.
That resistance level led to the pullback of later last week. I think, though, the pullback was very well contained. We backed off to about the ascending trendline of the November low. Moreover, volume was light, and it was lighter on the down days than it was on the up days. There was no big rush to sell. In light of what we have been through in recent months that is, in itself, an accomplishment. The trading since October is taking on the look of a big inverse head and shoulders. If that is the case, then the resistance that turned us back early last week becomes very important. A move above that level,
especially with heavier volume and a widening trading range, would suggest a good advance was getting under way. My technical tools favor such a scenario.
On a long-term basis I still think the chart below is the operative picture. We are still very close to the bottom of the sideways consolidation that began eight years ago. A return to the upper regions of that consolidation would match the sort of action we saw in the prior big consolidation that took place in the sixties and seventies.
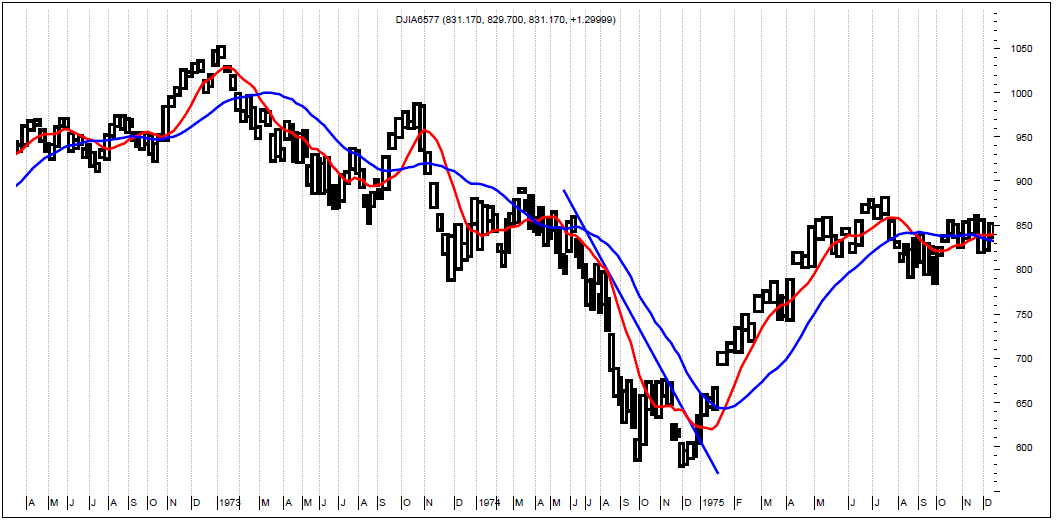
I continue to think the closest historical parallel to our current market is the decline of
1974-1975, shown below.
Many of the similarities are very striking. In 1973 the decline began in earnest in October, as it did in 2007. A major low was made in October of the next year, as it was in 2008. That low was tested and slightly exceeded in November in both instances. From there until January of the next year a good rally took place, but then ran into resistance in mid-January, just below the November highs. That puts us at the current time in the repeat scenario. In 1975 the next move was a penetration of the November highs with extreme power, heavy volume and even an upward gap. 1975 was an excellent year. The Dow went up about forty percent by late July before moving sideways for the rest of the year. I wonder if history will continue to repeat.


What's been said:
Discussions found on the web: