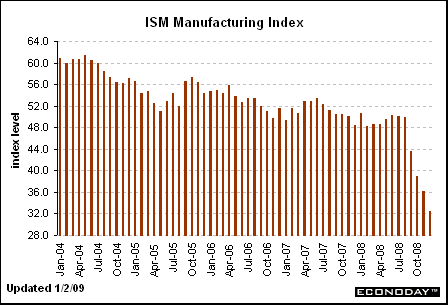
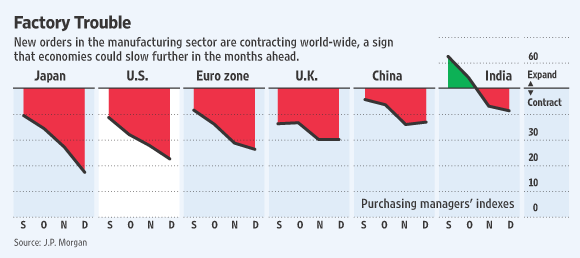
I haven’t had a chance to comment on the ISM data, but a few charts are just about as much info as you need. Remember, 50 is the dividing line between expansion and contraction:
>
December ISM Index
>
via WSJ
>
Source:
Manufacturing Tumbles Globally
KELLY EVANS and ROBERT GUY MATTHEWS
WSJ, JANUARY 3, 2009
http://online.wsj.com/article/SB123094144619950373.html


What's been said:
Discussions found on the web: