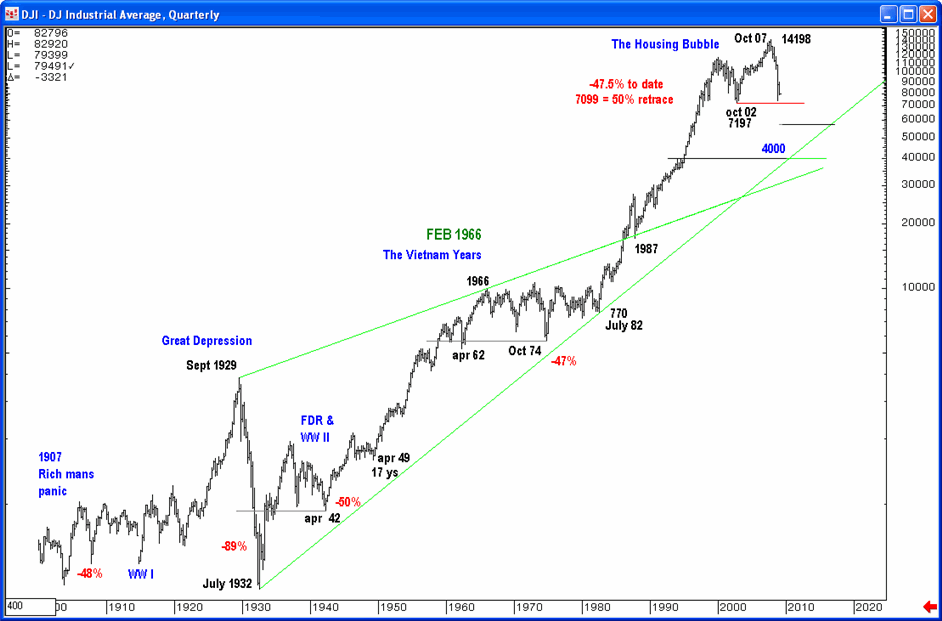
Since you are into posting long term charts, here is another one. You might want to take note of the years ending in 2. There is a ten yr cycle from 1932-1942, a 40 yr cycle from 1942 to 1982 and 50 yr cycle from 1932 to 1982. Projecting 10 yrs from 2002 we get 2012 which fits with the Mayan calendar dates. If you shoot out 40 and yrs from 1982, you get 2022 and 2032. Just fun with cycles.
The long-term 1932-1982 trendline is sloping into 4000 in 2009. It is a bet I am sure the Black Swan guru has a few nickels on.
Event-Driven Research for Risk Managers
John Bougearel
Director of Financial and Equity Research
Structural Logic, Inc.


What's been said:
Discussions found on the web: