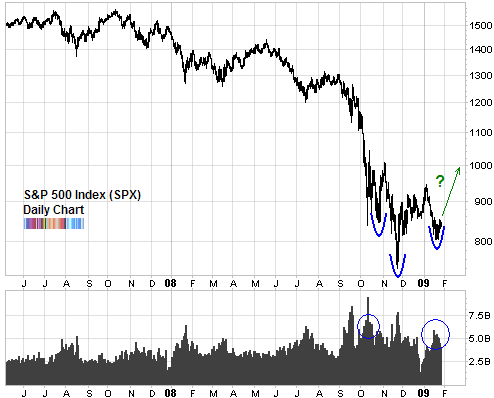
Trader’s Narrative sends along this chart:
Here’s their explanation:
Head and shoulder formations are one of the most fundamental technical patterns. They are arguably one of the easiest to recognize on a chart and are almost always found at turning points in price. Right now we are seeing the S&P 500 Index (SPX) carving out what looks to be the right side of a head and shoulder formation.
The defining element of this patterns is not only the striking silhouette it leaves behind on price charts but also the volume that accompanies it. For downtrending reversals, like this one, we want to see heavy volume come in as the right shoulder is created. Ideally, a burst of activity both in price expansion and volume cements the pattern as it decisively breaks through the neckline.


What's been said:
Discussions found on the web: