>
One of the things we like to do with Fusion IQ is review the full universe of stock scores and the new Buy & Sell ratings.
From time to time we can glean information from our overall statistics to get a handle on what is going on under the surface of the market.
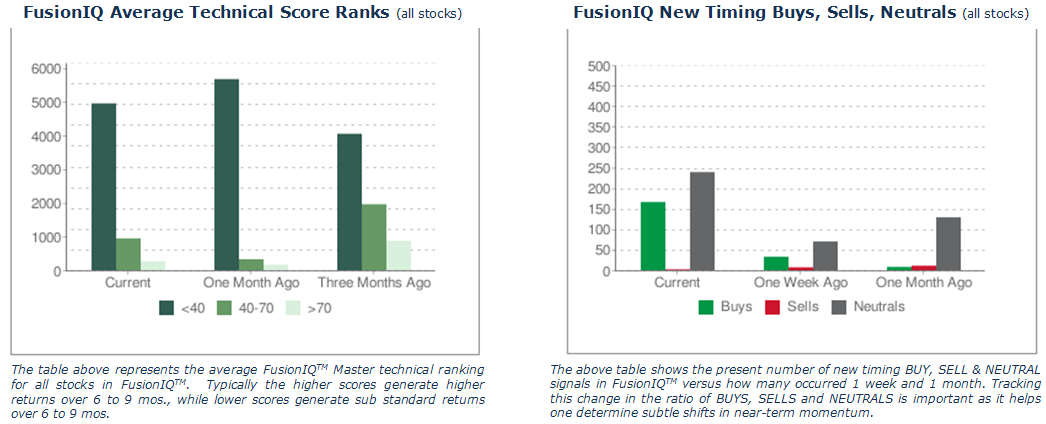
Consider the tables above: They represent two key metrics we track. The first table is Average Technical Score Rank, and it looks at how many stocks fall into each of three categories of our average numeric score of technical factors only.
Three months ago, when 4,200 issues in the Fusion IQ universe were below a 40 rank, the market was sending us a clear bearish message. This weakness then continued and peaked one month ago. Interestingly enough we see now that quickly over 1,000 stocks have moved back above the less than 40 score range indicating an overall improvement vis-à-vis these stocks moving into a higher score class range.
The second table highlights near-term momentum changes by looking at the ratio of timing BUYS, SELLS and NEUTRALS today versus the same time one week and one month ago. There has been a significant shift in the last week as 160 stocks are now registering new timing BUY signals. That’s a significant improvement over last week and last month.
In summary what these two tables tell us is that under the surface the market is seeing a subtle positive momentum shift (from extreme oversold conditions) that suggests a long side trade makes more sense at present levels for a tradable rally.


What's been said:
Discussions found on the web: