>
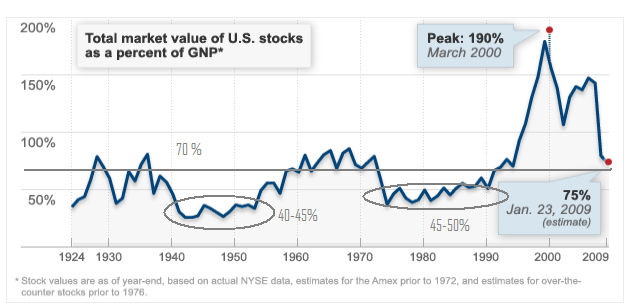
I look at the above chart, and it does not suggest the market is particularly cheap — its cheaper than ti was, but the 1940s were much cheaper, as were the 1970s and early 80s.
Here’s the excerpt from the Fortune column:
According to both this 85-year chart and famed investor Warren Buffett, it just might be. The point of the chart is that there should be a rational relationship between the total market value of U.S. stocks and the output of the U.S. economy – its GNP.
Fortune first ran a version of this chart in late 2001 (see “Warren Buffett on the stock market”). Stocks had by that time retreated sharply from the manic levels of the Internet bubble. But they were still very high, with stock values at 133% of GNP. That level certainly did not suggest to Buffett that it was time to buy stocks.
But he visualized a moment when purchases might make sense, saying, “If the percentage relationship falls to the 70% to 80% area, buying stocks is likely to work very well for you.”
Well, that’s where stocks were in late January, when the ratio was 75%.”
And how is that buy working out so far ?
>
Source:
Buffett’s metric says it’s time to buy
Carol J. Loomis and Doris Burke
Fortune, February 4, 2009: 9:49 AM ET
http://money.cnn.com/2009/02/04/magazines/fortune/buffett_metric.fortune/index.htm


What's been said:
Discussions found on the web: