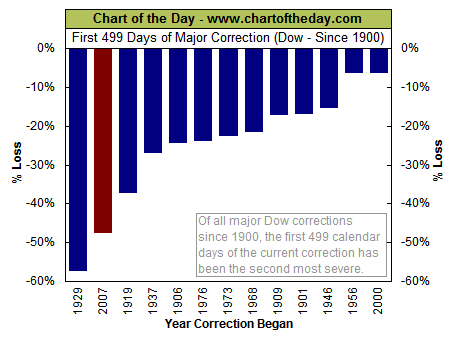
The Dow put in its record high of 14,164.53 back on October 9, 2007, and on February 19, closed at 7,465.95 – down 47.3% from its peak made 499 calendar days ago.
For some perspective on the magnitude of the current bear market, today’s chart compares the current, 499 calendar day old Dow correction to that of all other Dow corrections, 499 calendar days after their respective peak (and that were still ongoing).
Today’s chart illustrates that, at this stage, the current correction has been by far the most severe correction in the post-World War II era and the second most severe correction since 1900. The only correction that was down more at this stage was the correction that began in 1929.
via Chart of the Day


What's been said:
Discussions found on the web: