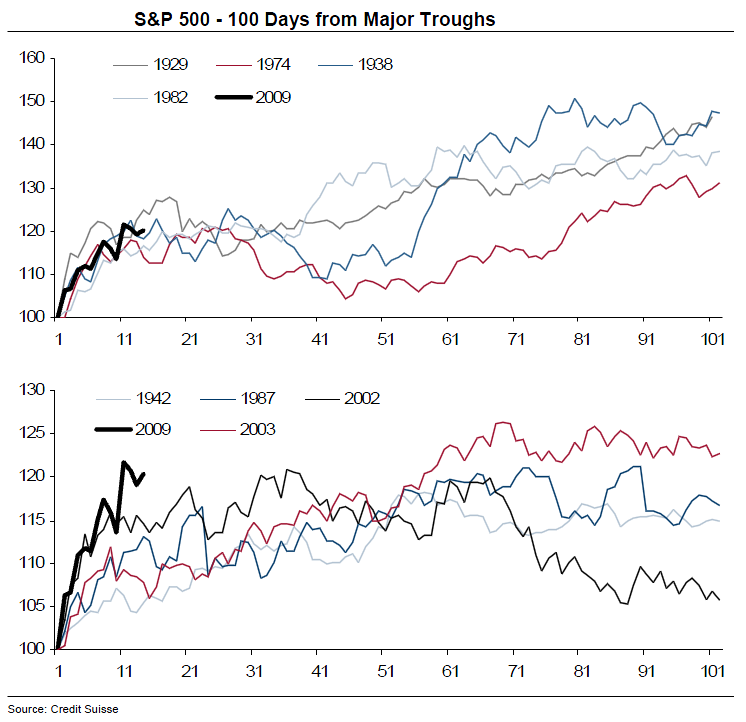
Credit Suisse Fixed Income Group noted the diversity of performance around the first 100 days of major
market lows in US equities.
The first of these shows the past episodes that might turn out to be the most relevant. Note that one of these is the post 1929 crash bear market rally – it just happened to be 46% or so over five months. Which is actually typical of the first year of major bull markets.
The second shows some less exciting episodes that were nonetheless significant market bottoms rather than mere staging posts towards significant new lows.
Nice chart!
>
>
Source:
The First 100 Days
Jonathan Wilmot, James Sweeney, Matthias Klein
Credit Suisse, Fixed Income Research, 26 March 2009
http://www.credit-suisse.com/researchandanalytics


What's been said:
Discussions found on the web: