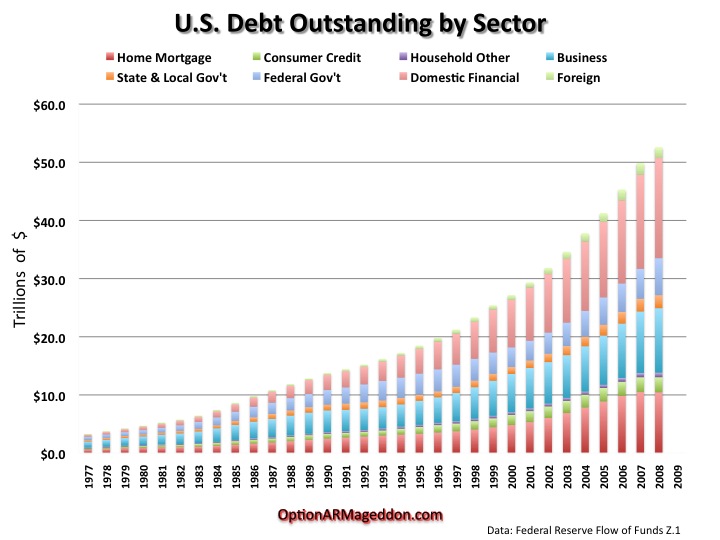
Last nite, I mentioned U.S. Household Net Worth fell 18%. This morning, Rolfe Winkler sends along this chart based upon the Q4 2008 Flow of Funds from the Federal Reserve.
>
To put data from the chart above in perspective, the one below compares the data to GDP. I’m using annual data here, so the increase at the end of 2008 is understated. GDP for the full year 2008 was higher than 2007. But Q4 2008 GDP was lower compared to Q3. So towards the very end of the year, the denominator (GDP) is going down even as the numerator (Debt) is going up. On a percentage basis, this means Debt/GDP is presently rising at an accelerating rate.
>
Source:
Charts: U.S. Debt Expanding, Homeowner Equity Crashing
Rolfe Winkler
Option Armageddon, March 12, 2009 – 9:51 pm
http://optionarmageddon.ml-implode.com/2009/03/12/updated-debt-stats/
Previously:
US Household Net Worth Falls 18% (March 12th, 2009)
http://www.ritholtz.com/blog/2009/03/us-household-net-worth-falls-18


What's been said:
Discussions found on the web: