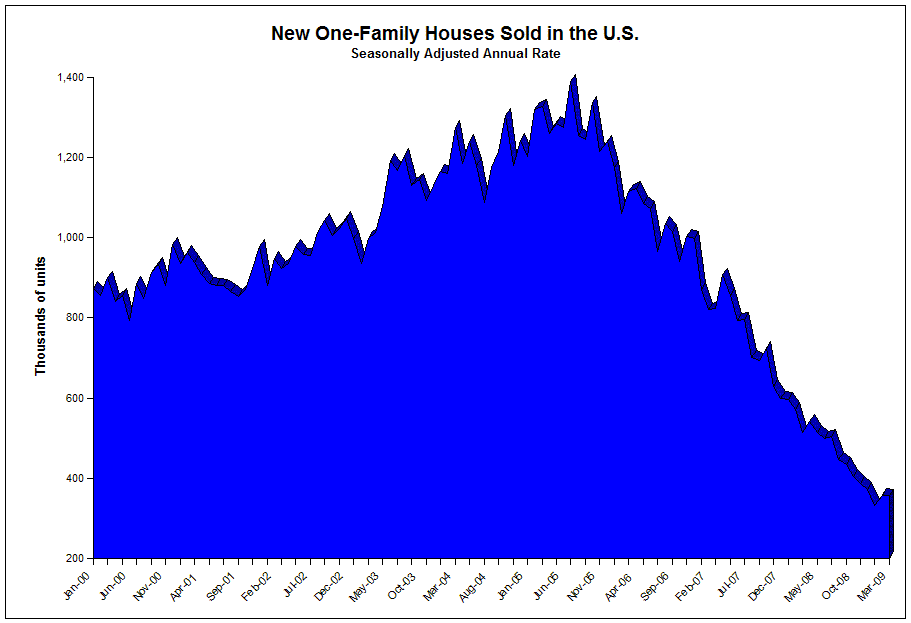
Another ugly New Home Sales report: There was no statistically significant monthly improvement, as the reported change of 0.6% was within the margin of error of ±19.0%. The year-over-year data, however, was god-awful: A drop of 30.6% (±10.7%) below the March 2008 data.
There is a slight silver lining in the inventory: Months supply fell to 10.7 from 11.2 — the lowest level since October 2008. The cycle high was in January 2009 at 12.5. And the absolute # of homes for sale fell to 311k from 328k to the lowest since Jan ’02. While this is an improvement, 6 months is the 30 year average, so we still have a ways to go.
And as Rex Nutting points out, even with Builders cutting prices in March, “the time it takes to sell a home rose to record high of 10.2 months.” Blame competition from cheap foreclosures, with nearly half of all existing sales distressed property.
>
New Home Sales

Source: Census Bureau
>
Previously:
Media Misreports New Home Sales –they didn’t rise, they fell 41% (March 26th, 2009)
http://www.ritholtz.com/blog/2009/03/new-home-sales-fell-41-in-february-2009/
Source:
NEW RESIDENTIAL SALES IN MARCH 2009
Census Bureau, APRIL 24, 2009 AT 10:00 A.M. EDT
http://www.census.gov/const/newressales.pdf
New Home Sales Chart
http://www.census.gov/briefrm/esbr/www/esbr051.html


What's been said:
Discussions found on the web: