>
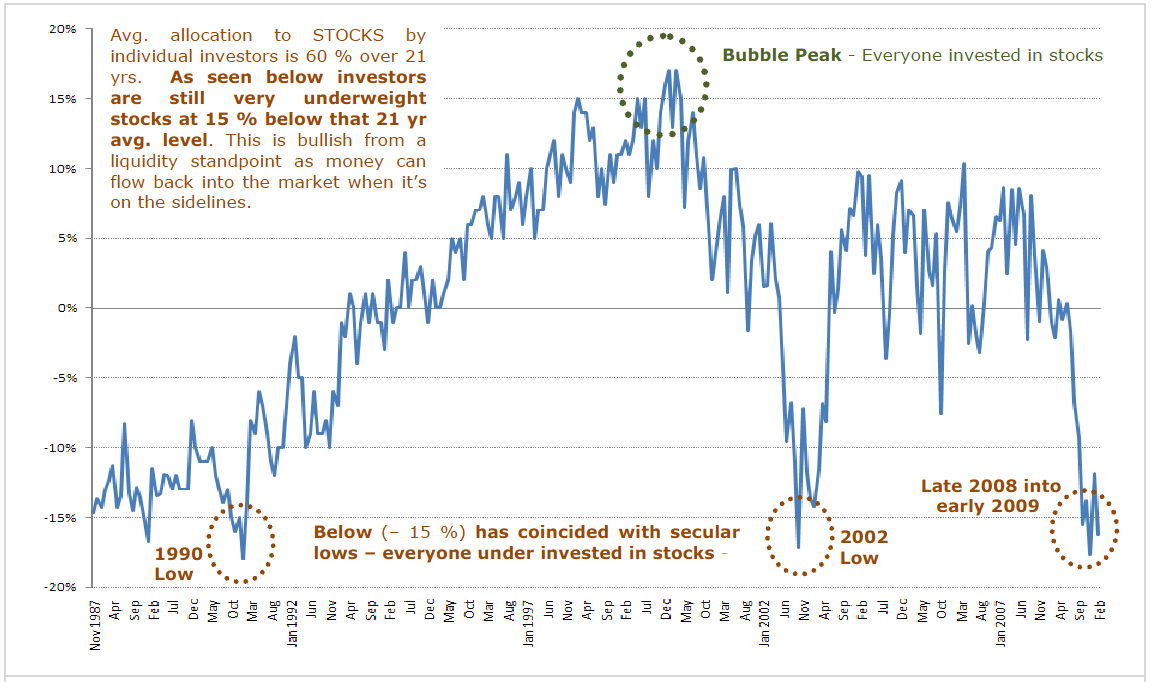
AAII Stock – Deviation from 21-Year Mean Allocation (Monthly Charts)
>
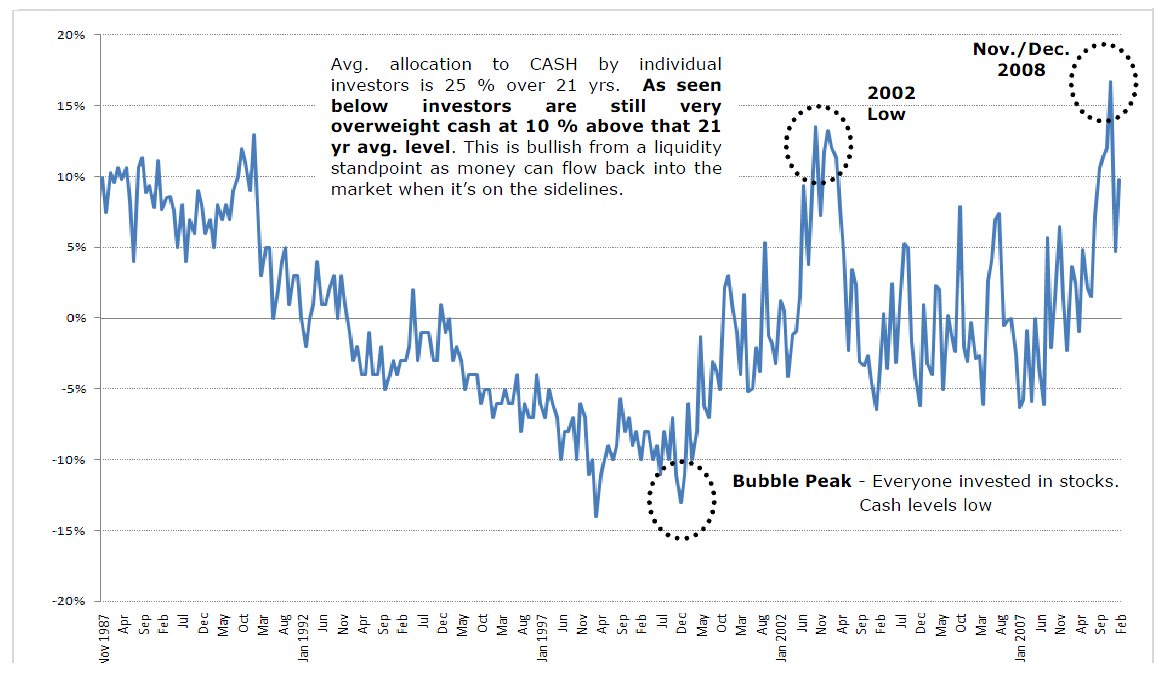
Cash Allocation Survey – Deviation from 21-Year Mean Allocation (Monthly Charts)
>
Fusion IQ Sentiment Review:
Secular liquidity, aka buying power, as seen through the eyes of current individual investor allocations relative to historic norms shows ample liquidity on the sidelines and in cash. Current levels approximate liquidity seen at the 1990 and 2002 lows, which continues to suggest that there is likely enough liquidity to keep moving stocks higher in this snapback/bounce.
When combined with incredibly negative investor expectations, no alternative for return in fixed income and the principles of mean reversion at work moving higher with some volatility, pullbacks (possible re-test of lows) and consolidation is a reasonable expectation still. Remember continue to watch how stocks act on bad news. When they rally on bad news not only does it suggest investors are looking over the valley it also suggests liquidity is ample to absorb then repel the selling.
Granted after a 25 % rally off the lows and stiff resistance in front of us near 850 (S&P 500) it won’t be an easy climb. The reason it is never is an easy climb off the lows is because at every level higher on an index pockets of under water investors (ie. losing money positions) can sell at break even prices. Nonetheless these indicators suggest we can move higher over time. We will continue to monitor for changes that would suggest this argument is no longer true.
Shorter term sentiment measures such as Put/Call ratios and AAII Bearish Sentiment Survey (see in our Sentiment Review Note) which were decidedly bullish for the market several weeks ago via their bearish readings have moderated but are not at levels yet that would be construed as a negative.


What's been said:
Discussions found on the web: