It seems that Traders love today’s NFP data. Let’s take a closer look at the actual numbers to see what we can tease out:
-Nonfarm payroll employment decline in April (-539,000);
-Total recession job losses (December 2007 forward) now total 5.7 million;
-That is 6.5 million job losses per year on an annualized basis;
-Private-sector employment fell by 611,000; the differential between NFP and private sector employment is primarily new hires for the 2010 Census;
-U3 Unemployment rose from 8.5 to 8.9%; unemployment is now at a 25-year high;
-U6 Unemployment, the broadest measure of “labor underutilization” rose to 15.8%; This is up 77.5% (6.6 percentage points) from a year ago;
–Birth Death adjustment added 226k to the total of employed workers, (April is a pretty big month for this historically)
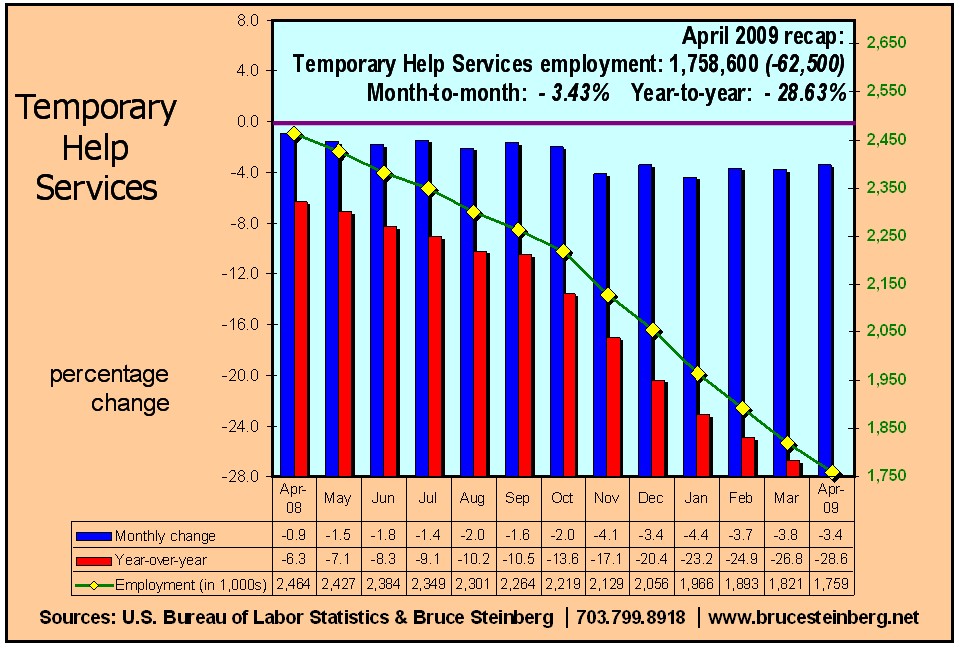
-Temporary Help Services was down 3.4%; Year-to-year loss was nearly 29%. Total Temporary Help losses are now over 910,000 (-34 percent) since December 2006.
-All sectors saw job losses except Education, health services and government;
-Downward revisions made to February and April were for a net loss of 66,ooo positions;
Two additional things to note:
Its hard wrapping my head around a more than half million monthly job loss as signs of stabilization;
Second, I hasten to point out that the “adverse” scenario the Treasury/Federal Reserve used in their stress test was a 9.5% Unemployment Rate. We should be there by sometime this summer, and above 10% by the end of the year . . .
>
chart courtesy of Brucesteinberg.net


What's been said:
Discussions found on the web: