>
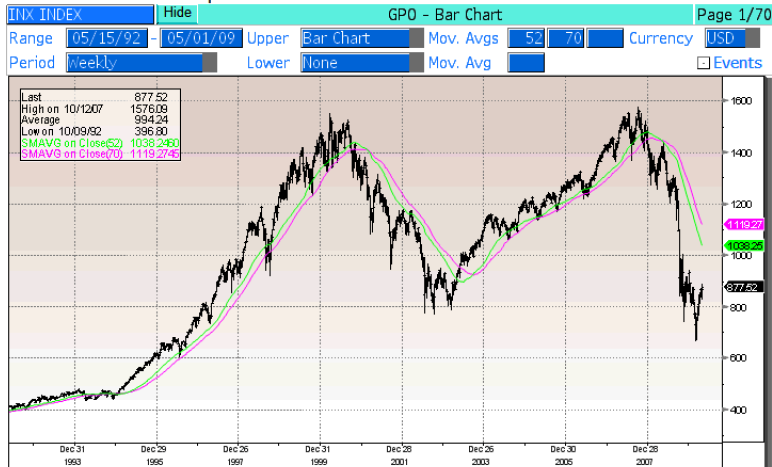
Here is the S&P 500 Index on a weekly basis since May 1992. The slope of the yearly (52 week) and 70 week (favored by some researchers but more appropriate for commodities, which are more volatile than stocks) clearly defines bull and bear markets. Stocks can rally further and still not be in a bull market.
>
>
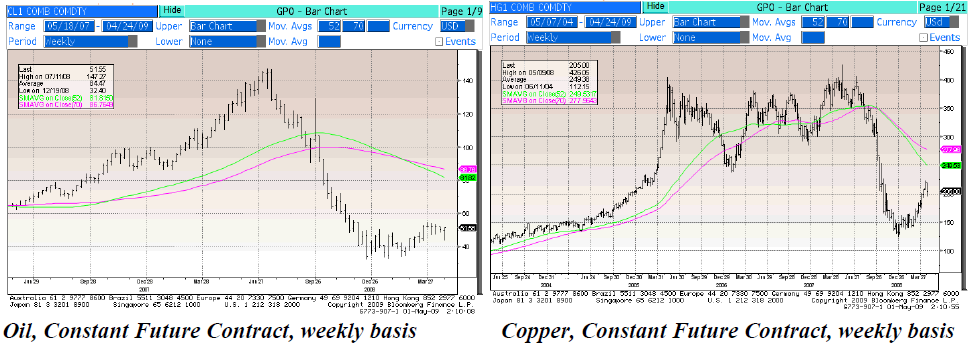
Stocks are up about 30% from their lows. Oil is up 67% from its 12/19/08 low. Copper is up 76% from its 12/26/08 low. The moves in oil and copper make a much better case for being in bull markets.
>
Neither oil nor copper are in a bull market. And they are up a multiple more than stocks from their lows.
Bottoms can only be verified in retrospect; and it’s too early to adamantly state that the bottom is in for stocks or the economy. It will take time and improving data to definitively make such assertions. The prudent will wait to make the conclusions; the intemperate and the visceral will not.
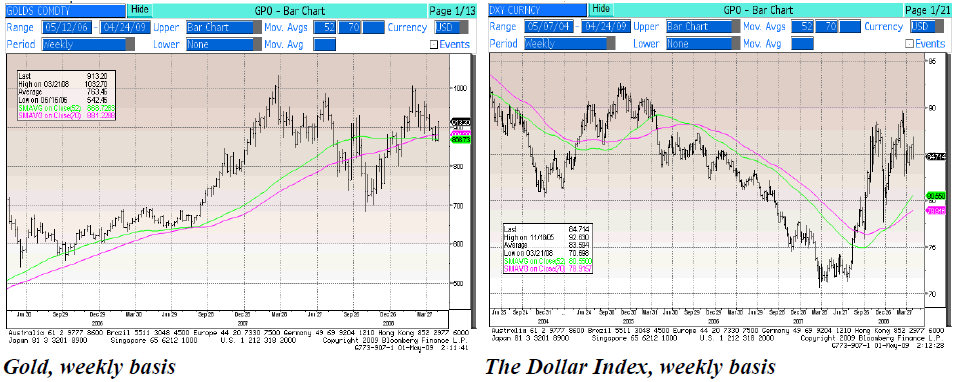
Here are two items that are in bull markets (weekly charts), but the structures are different. The one that is embryonic [right] shows one configuration for a new bull market.
>
>


What's been said:
Discussions found on the web: